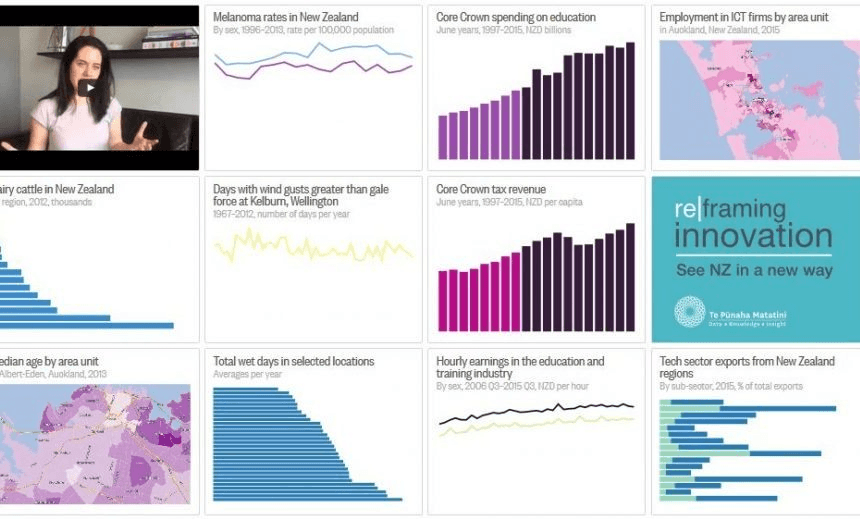
Today the Spinoff and Figure.NZ launch a new weekly feature, in the form of a chart that tells us something about New Zealand. After extensive thought, we have decided to call it the ‘Chart of the Week’. The plan: to bring more data to more people, explains Lillian Grace, Figure.NZ CEO.
After catching a glimpse of each other across the playground and a flurry of play-dates, we’ve came to the conclusion: Figure.NZ and The Spinoff should become friends to bring more data to more people, together.
Figure.NZ is all about helping people use numbers to understand the world around them. We love nothing better than to see numbers out in the wild, in use by people to help describe what’s going on. With The Spinoff, we intend to present data to you in both fun and serious ways.
The Chart of the Week (the first installment is here) will be accompanied by some chit-chat about what it means, and we’ll also be putting together a cool little quiz for you each week. How many deer are farmed in Canterbury, you ask? (about 290k). How many days each year does Invercargill get more than 1mm of rain on average? (161 days). How many labradors are there in New Zealand? (Guess! And then find the answer here, I reckon it’ll be more than you think.)
We’re also keen to see more numbers used in stories and discussions, so we’ll be using our data peeps to point people in the direction of what data exists on a topic. We’ll leave them to it when it comes to creating the story, though – Figure.NZ is just here to help people think with numbers, not to tell them what to think.
A bit more about Figure.NZ
We’re a charity that is working to make New Zealand’s public data easier to find and easier to use. We are here to enable everyone to make sense of data so they can see New Zealand clearly, in a way that inspires. We think data literacy can change society for the better in the same way that language literacy did, and that the economic, social and environmental benefits of widespread data use are huge.
Practically, data providers engage us to take data spread around the internet in a variety of tricky formats, and we standardise it and make it easier to use using the tech we’ve built. We publish it all on Figure.nz in a variety of consistent formats, including about 30,000 graphs and maps, free for everyone to take and use.
P.S. We’re currently rebuilding our public API and would love to know what you’d find useful, you can read more about it and contact us here.
