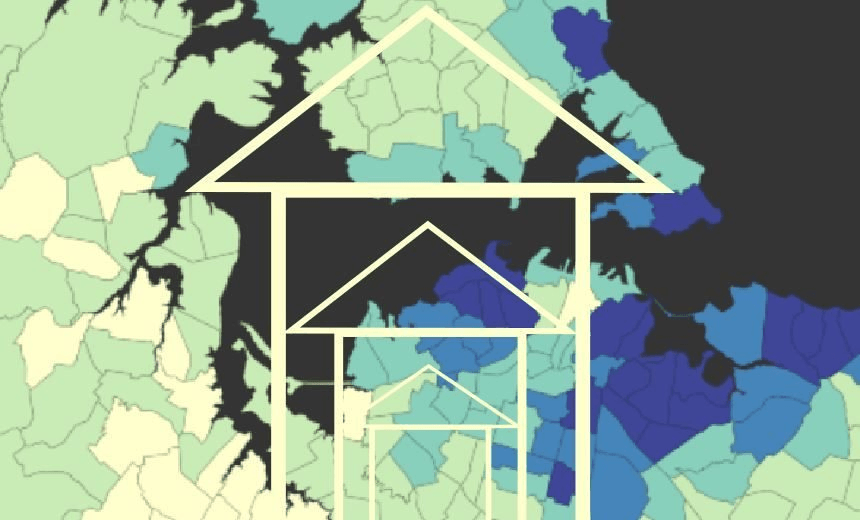
Rental prices in NZ’s largest city continue to escalate, with lower income households hit the hardest. Chris McDowall, who built the stunning Spinoff Unitary Plan maps, has visualised the change – accounting for inflation.
Last week the Ministry of Social Development released the annual Household Incomes Report. Two sentences in the summary immediately stood out.
Housing costs now take a much greater proportion of household income especially for low-income households. For all “working age” (under 65) households they are up from 14% in the late 1980s to 20% in 2015. For the bottom quintile, they are up from 29% to 54%.
Put another way, the 20% of New Zealand households with the lowest incomes are spending over half their earnings on housing. This extraordinary statistic got me wondering how the cost of renting in Auckland has changed over the last couple of decades. So I went hunting for data.
The Ministry of Business, Innovation and Employment (MBIE) publishes quarterly bond data at the level of StatisticsNZ area units going back to 1993. The tenancy bond database records all new rental bonds lodged by private sector landlords with the Ministry each month.
The following animation uses this dataset to map the mean rental price of Auckland houses (ie not apartments) since 1993. To enable comparison across the years, I converted the value for each quarter into June 2016 dollars according to the Consumer Price Index. I also applied a one year rolling average to smooth out occasional erratic blips in the dataset.
The map has been looping in my browser for the last 30 minutes. I keep watching the over $700 group slowly inkblot out from Herne Bay and Orakei Basin to swallow half the isthmus. It’s worth noting that $700 is a threshold, not a limit. In June 2016, the average weekly house rental in Herne Bay was $1,039 a week and $1,057 in Waitaramoa (where Remuera meets Hobson Bay).
There are many fascinating stories in this animation, but the broad message is a familiar one. It is considerably more expensive to rent a house in Auckland in 2016 than at any point in the last 23 years.


