Temperatures Rising
How do we know the climate is changing?
Data essay by Chris McDowall
Aotearoa is getting warmer. How do we know this and what will happen over the next 100 years?
At the end of every summer, autumn, winter and spring, NIWA the Crown scientific research institute, publishes a summary of the season’s weather. These reports make for sobering reading. Winter 2020 was New Zealand’s warmest winter on record. Last summer, Southland, Otago and the West Coast experienced extreme flooding while simultaneously much of the North Island was in drought. In Spring 2019 we had the warmest November on record. Scan your eyes down the seasonal climate summaries page and notice how often the words “warmer”, “warmest” and “hotter” appear.
NIWA’s annual climate summaries for New Zealand tell the same story at a coarser scale. Here are their headlines for the last four years.
- 2019: Our 4th-warmest year on record
- 2018: Our equal-2nd warmest year on record
- 2017: A year of weather extremes
- 2016: Our warmest on record
These warmer seasons and years are not a blip. They are the most recent instances of a warming trend of 1.09ºC since 1900.
New Zealand’s warming trend is part of changes happening at global scales.
Timeline of global average temperatures (1850–2020)
This chart shows how global temperatures have risen since 1850. It uses the average temperature between 1961 and 1990 as a baseline. Red bars represent years warmer than the 1961–1990 baseline period. Blue bars show cooler years.
Note how from the early 20th century the blue bars get shorter, start pushing above the baseline and eventually turn into longer red bars. Over the hundred years since then, the world has been getting warmer – and this is due to human activity.
Carbon dioxide, methane and other greenhouse gases trap heat in the earth’s atmosphere. When human society began to industrialise in the second half of the 19th century, we started burning a lot more fossil fuels. Burning oil, coal and natural gases released huge amounts of carbon, trapping more and more heat in the atmosphere. Over the 20th century, as populations grew and industrial processes scaled up, the world’s greenhouse gas emissions grew. As the concentration of carbon dioxide in the atmosphere increased, so did global temperatures.
Everywhere is getting warmer – and humans are responsible.
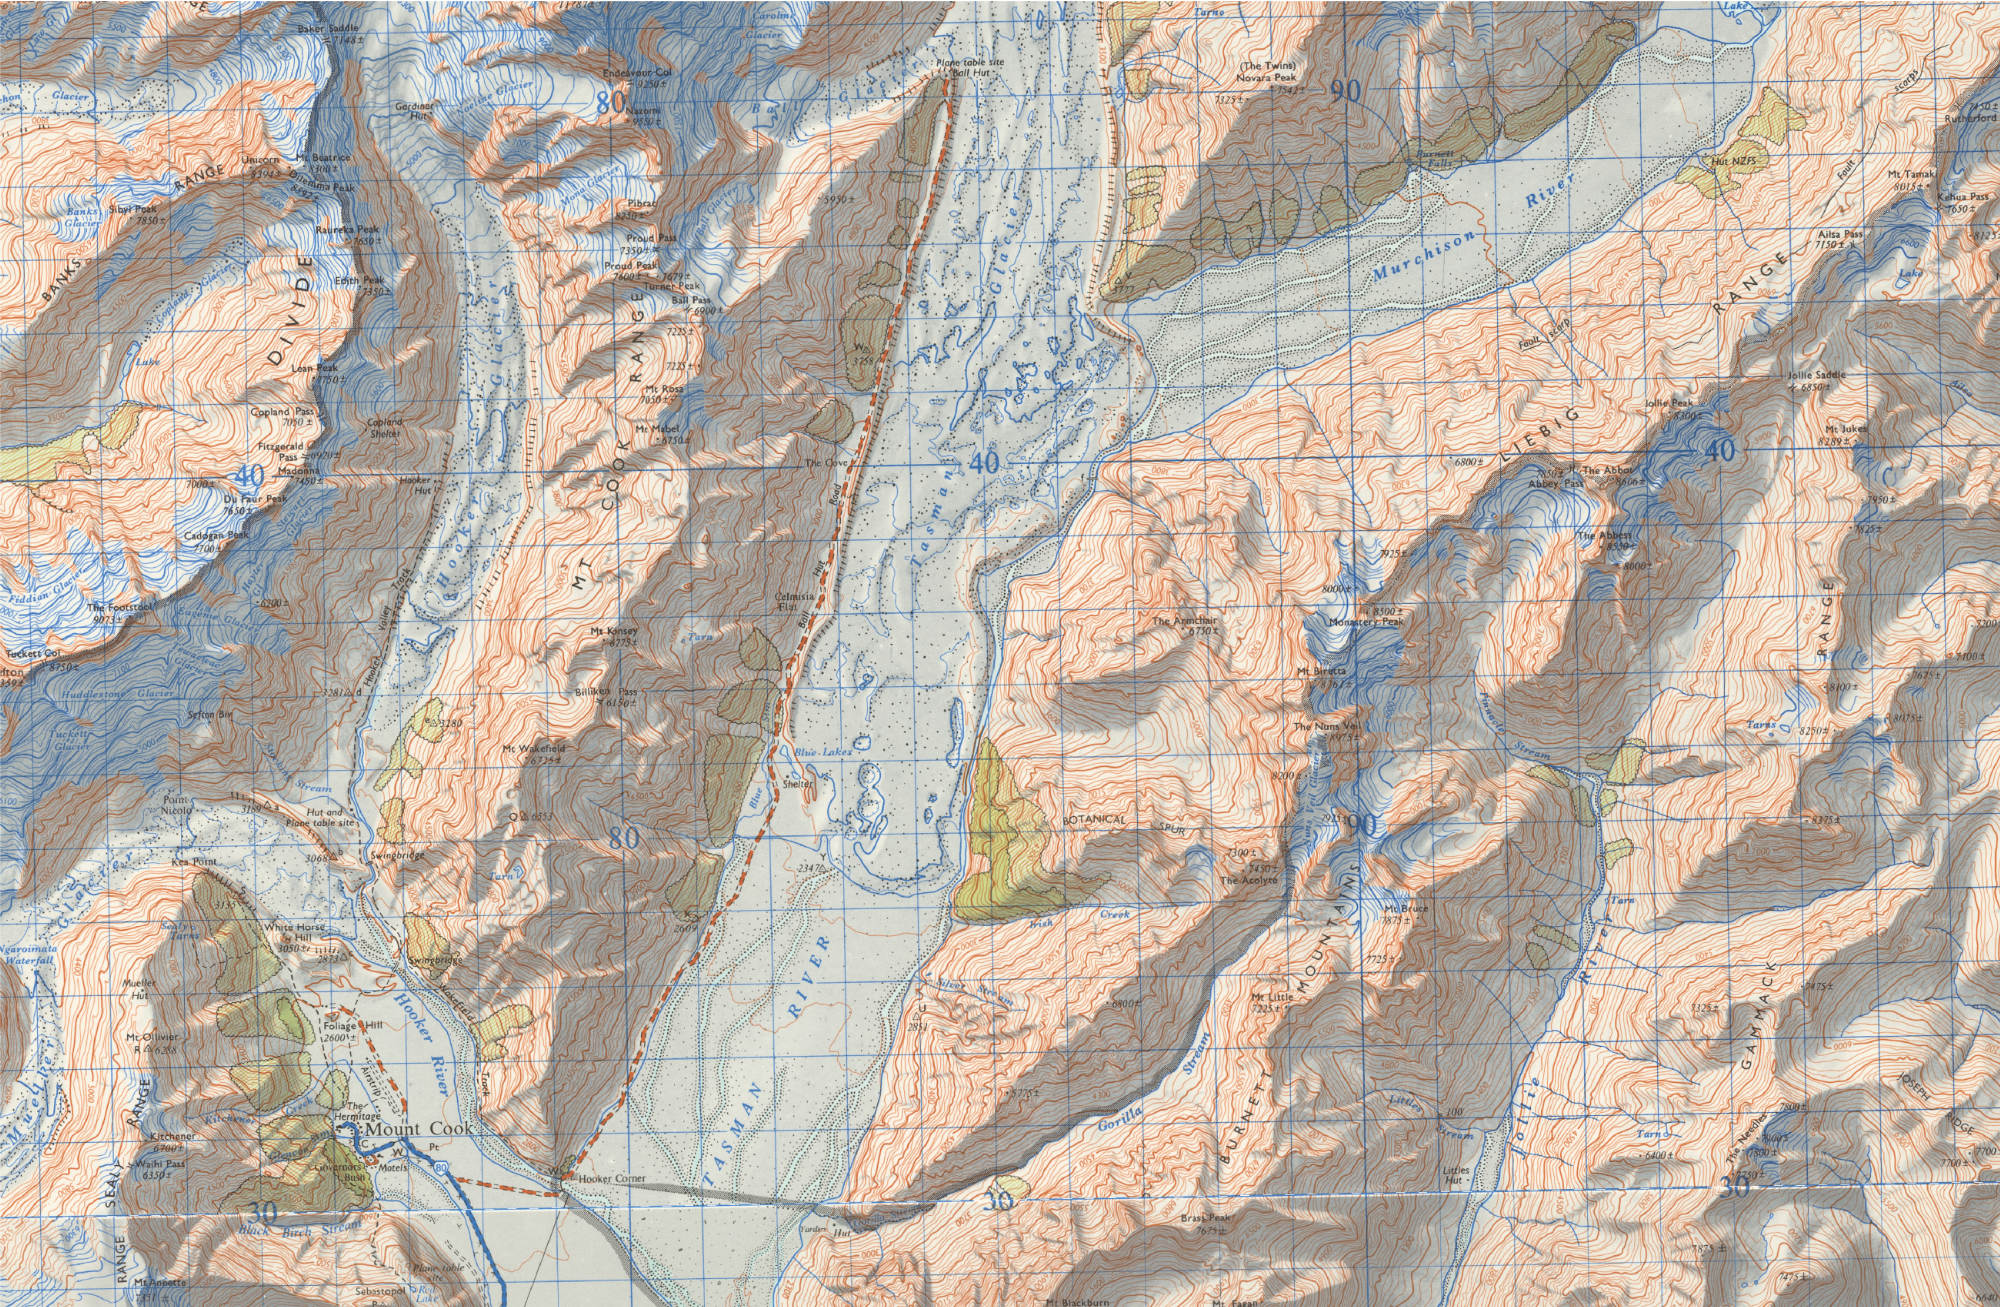
A new lake appears
Climate and weather are different. Weather refers to short-term atmospheric changes. Climate describes weather patterns over a long period of time in a specific place. Weather influences what you wear today, but climate tells you what types of clothes you should have in your closet.
Humans are sensitive to changes in weather, but unreliable at recognising long-term shifts in climate. The physiological effects of ageing, combined with the fallibility of memory, make it difficult for us to compare climate across decades. For a more reliable narrator, we can turn to the natural world.
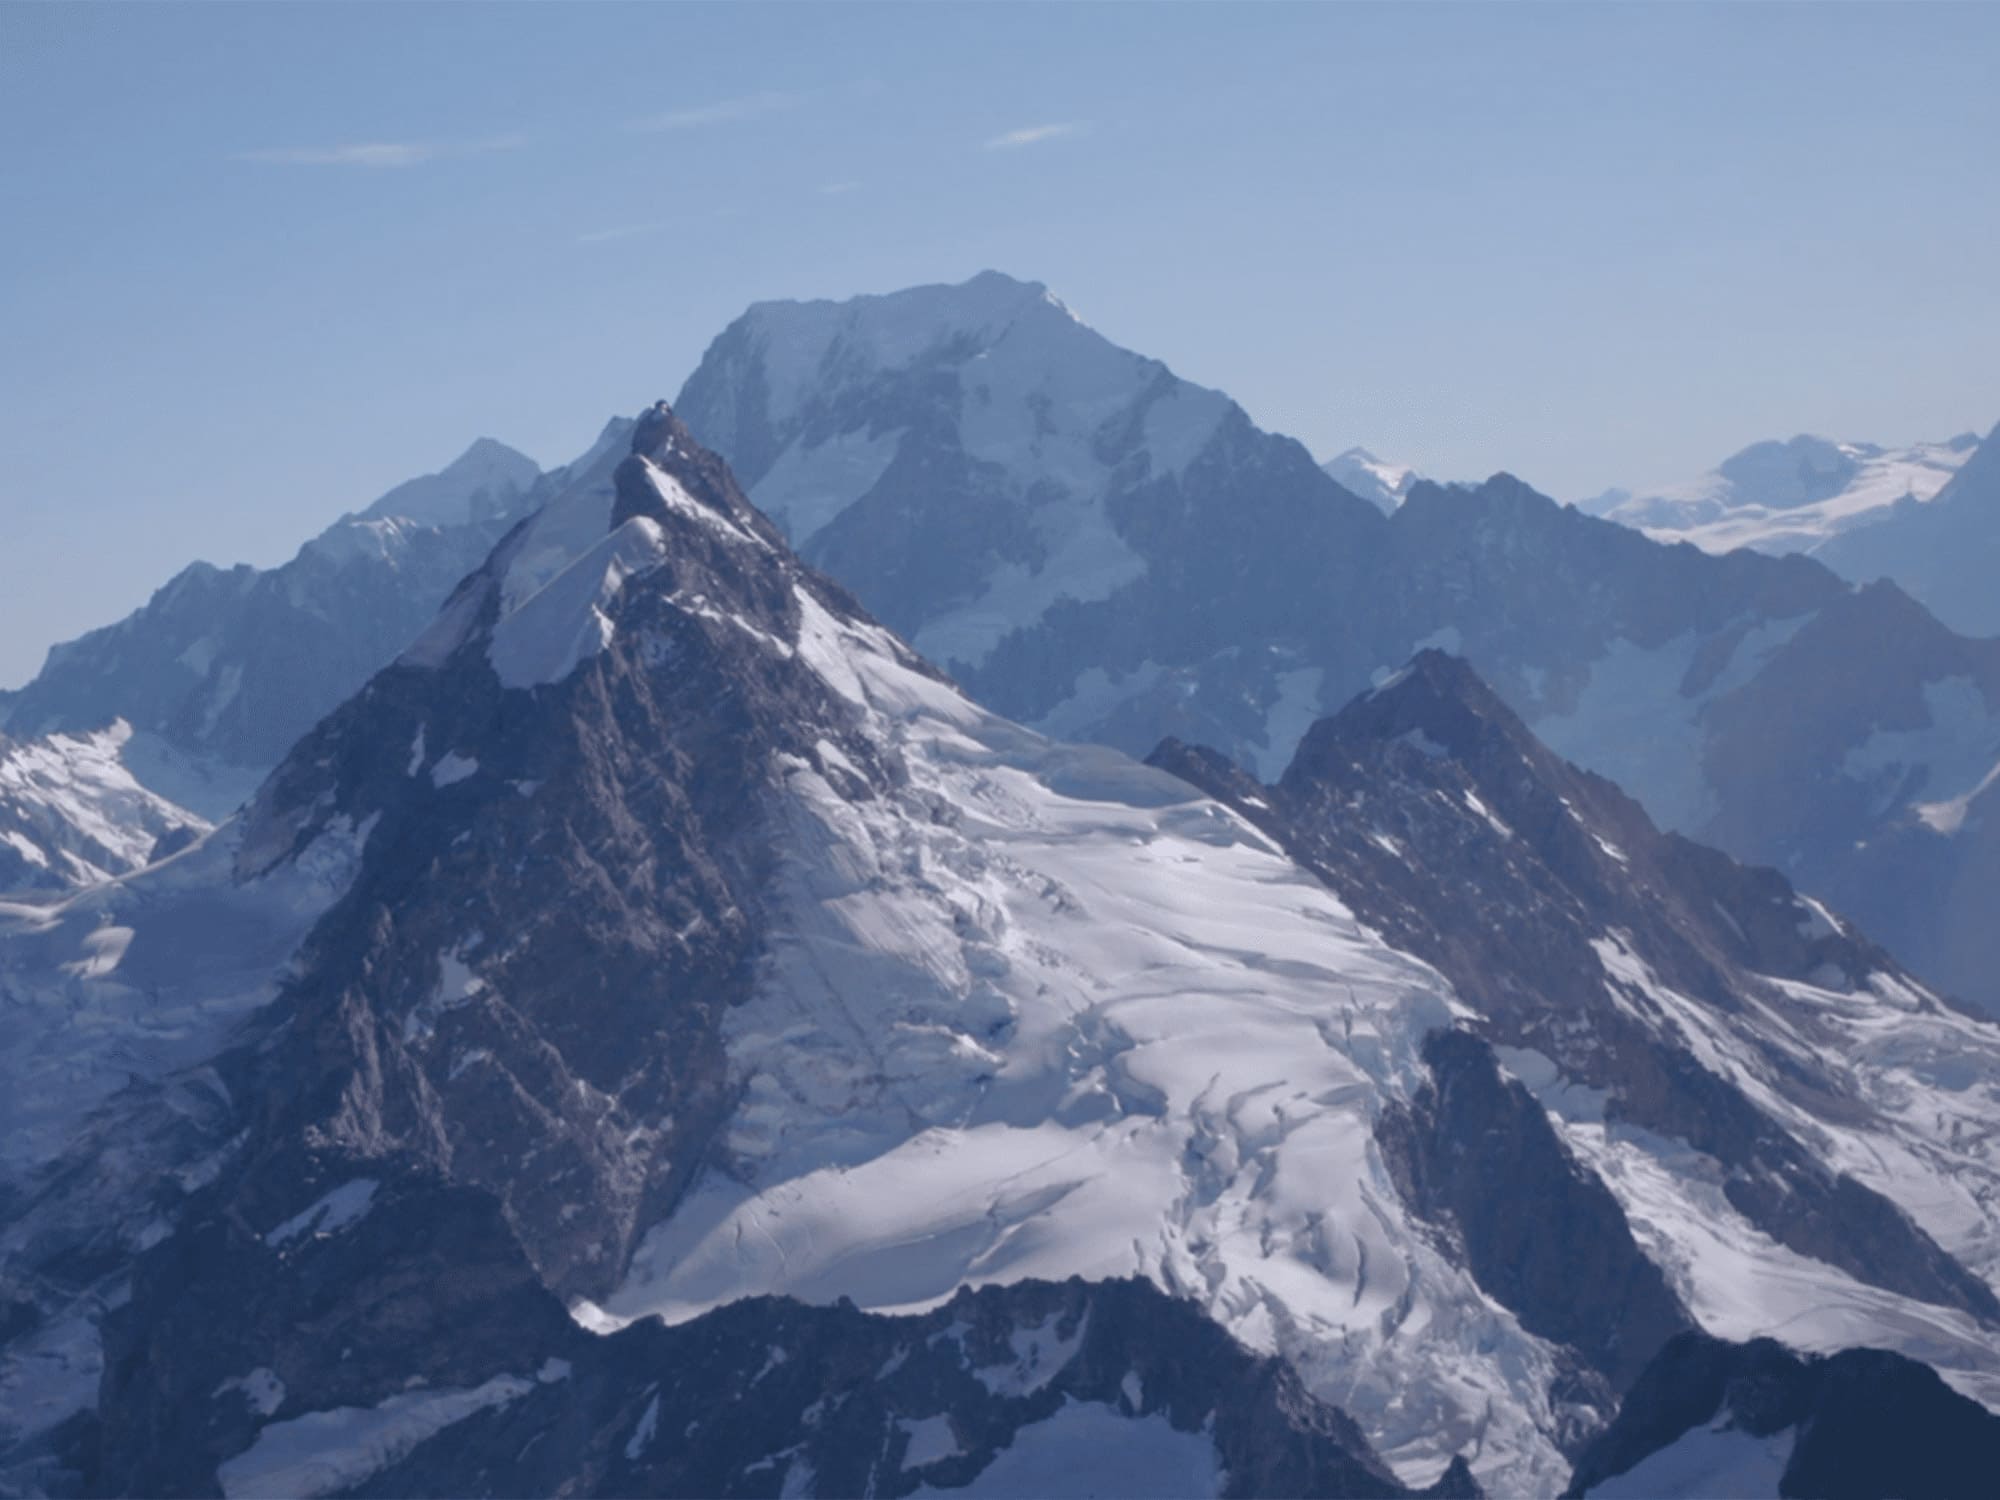
Glaciers are colossal bodies of frozen water. They respond to changes in temperature, but very slowly. One hot day, or even a hot season, will not mean the loss of a glacier; but repeated hot summers will have an effect. Glaciers experience climate, not weather.
Haupapa/Tasman Glacier is Aotearoa’s largest glacier. It flows 23.6km from Hochstetter Dome and Mount Elie De Beaumont in the Southern Alps towards the Mackenzie Basin.
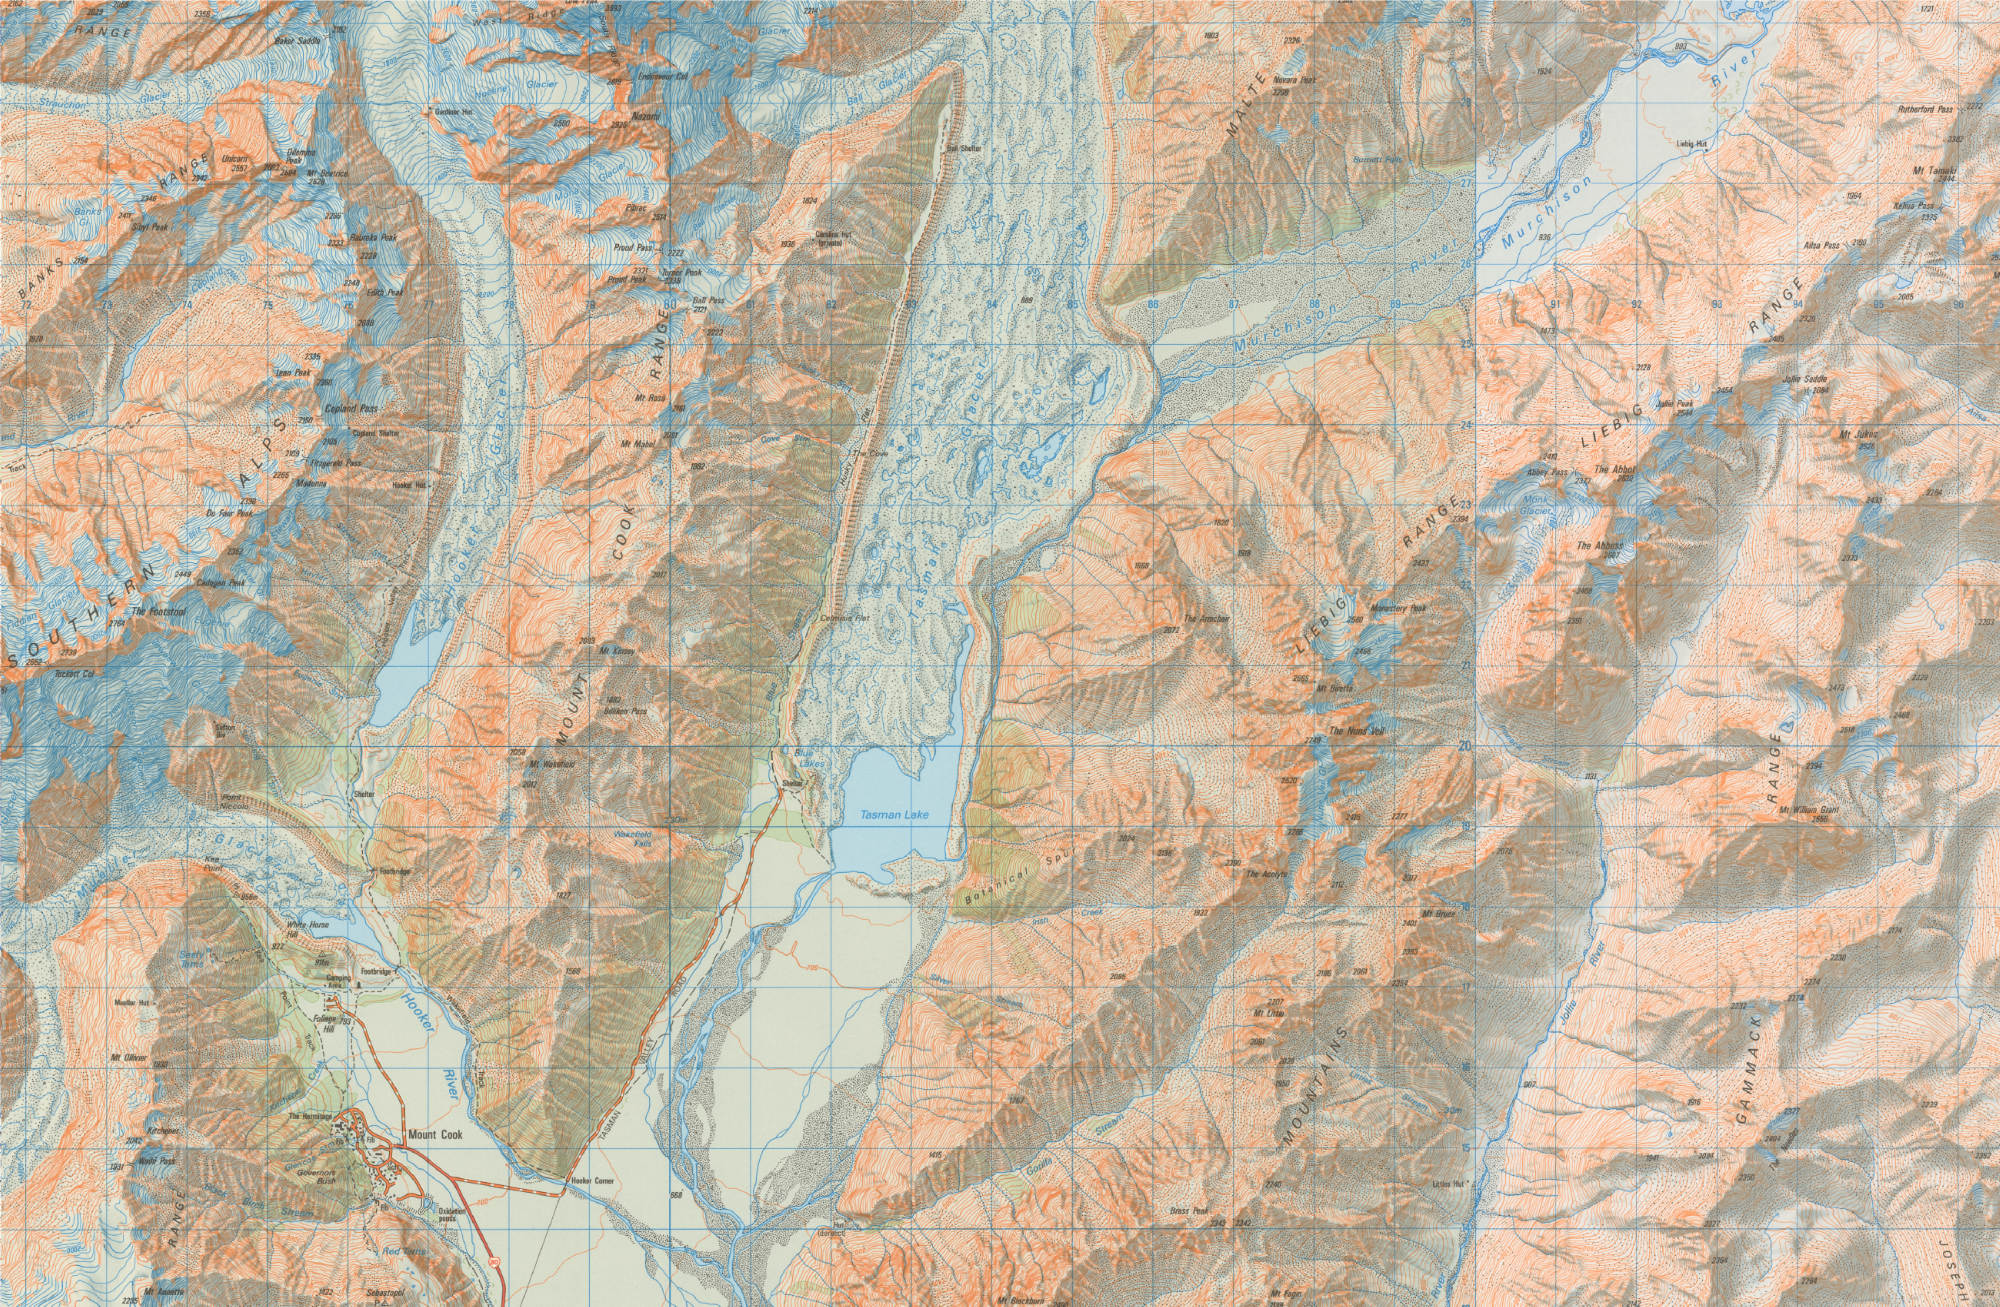

Ancient glaciers are melting. The climate is getting warmer. Our future is uncertain.
How might New Zealand change?
The chemistry and physics behind climate change have been well understood for decades. This knowledge is backed up by an ever-growing body of empirical evidence. The uncertainty is less in the science of climate change and far more in economics and geopolitics. How will humanity respond?
Different climate futures stretch out before us, depending on the volume of greenhouse gases humans emit over the coming century. The United Nations Intergovernmental Panel on Climate Change (IPCC) assessment reports focus on four of these futures. The IPCC refers to these different futures as “representative concentration pathways” or RCPs.
- RCP 2.6 is the mitigation pathway, which requires removal of some of the carbon dioxide already in the atmosphere. It is a “very stringent” future and many fear it is already slipping from our reach.
- RCP 4.5 and RCP 6.0 are stabilisation pathways. These intermediate scenarios involve emissions reaching a peak around either 2040 or 2080 and then declining significantly.
- RCP 8.5 is the business-as-usual scenario, where emissions continue to rise through the 21st century.
NIWA climate scientists have modelled how different aspects of Aotearoa’s climate will change over time under each of these possible futures. You can explore the full collection of these at Our Future Climate New Zealand.
Let’s take a look at one of the most revealing measures. How many hot days of 25°C or more does a place experience over an average year?
Scroll down to see more.
100 or more
75 hot days
50 hot days
25 hot days
0 hot days
100
75
50
25
0
Let’s focus on a single place.
Select a region from the list below to see how it may change:
Auckland currently has a mean annual temperature of about 15°C.
Under moderate climate change scenarios (RCP 4.5), temperatures in the Auckland region are expected to increase by around 3.1°C by 2090. If we continue down a high-emissions pathway (RCP 8.5), temperatures are forecast to increase by about 3.1°C. These changes may seem small, but they would have a big impact on extreme temperatures.
These different possible futures are nuanced, but the broad story is simple. Over the next 100 years, Aotearoa will get warmer. The greatest changes will happen in the north, but everywhere will heat up. The greater the concentration of greenhouse gases in the atmosphere, the more extreme this warming will be. In the next data essay we will start to see the impacts of these changes.