Everything we learned from a deep dive into digital advertising at the 2026 election

Some examples of what parties and third-party promoters have spent money on getting into your feeds. (Image: Tina Tiller/The Spinoff)
What parties, candidates and third-party promoters forked out to get their ads into your feeds.
How politicians use social media can say a lot about their campaigns. For example, the New Zealand Social Media Study found that politicians’ 2026 messaging on both sides of the political aisle was frequently framed around negative attacks, rather than positive descriptions of policy or the future. However, compared to the 2023 and 2020 elections, there was much less disinformation being spread by politicians online.
Beyond the messages that politicians are sharing, there’s a lot to be learned simply from seeing who is spending money on political advertising, and where that money is being spent. Unlike most election spending, the details of which can be murky, advertising transparency projects are a window into how parties are using social media.
Meta’s Ad Library and Google’s Ads Transparency Center were created in response to criticism that these platforms were allowing opaque and hyper-specific targeting during elections. TikTok also has an advertising transparency platform, but it isn’t operational in New Zealand.
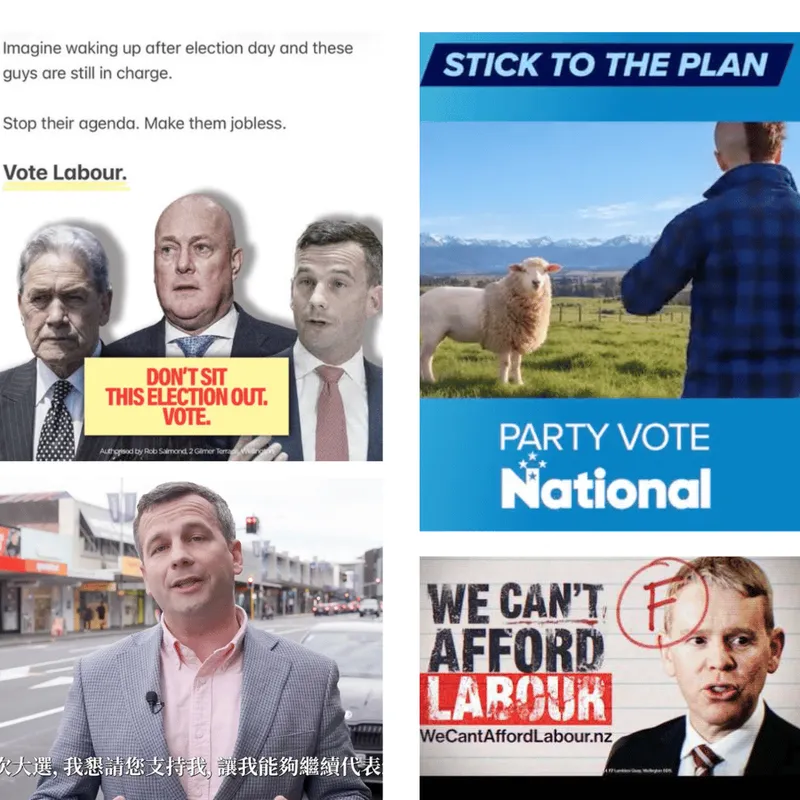
As a result, digital advertising is one of the few areas where it’s possible to see in detail how a party is spending its money, in almost real time. Each ad is individually categorised, and you can pick a particular advertiser and scroll through messages and imagery. It’s possible to see where the people who viewed an advertisement were based, and the gender and age of who looked at it. This is much more detailed than other spending that might be categorised in a party return, and party returns won’t be filed for several months (2026 returns are due in April next year).
The Spinoff looked at data from August 6 to November 6, the three months before the election. During this period, election advertising in New Zealand is subject to various rules, including spending limits.
Until returns are filed, the public won’t know exactly how much money parties spent on hoardings and billboards, on newspaper, news site, radio and TV ads or on campaign merch. They'll likely never know what was spent on hosting events or phone banking, on transport for candidates and focus groups, on polling and employing strategists. But it is possible to find out how much was spent on Google and Meta advertising immediately. And for the regulated period in 2026, that shows that the Labour Party massively outspent all other political groups.
The same holds true in Google’s data, which shows that Labour spent $532,800, while all other parties spent between $70,000 and $90,000.
This is a significant change from the 2023 election, where the Act Party spent hundreds of thousands of dollars more than any other party.
However, this grouping of spending shows only the split in spending between advertising from the main parties, not their individual electorate candidates. With the exception of Opportunity, which didn’t run any separate pages for its candidates, most electoral candidates had separate Facebook or Instagram pages for their individual campaigns.
Many candidates spent at least a few hundred dollars on advertising for their personal pages – if you saw your local electorate candidates popping up a lot in your feeds during the election lead-up, that is why. However, to focus more clearly on the big spenders, for this chart we applied an arbitrary cut-off of candidate pages that spent more than $1,000. Here, the trend is reversed: National candidates had more money for their individual pages.
Looking at the averages spent on candidate pages across different parties reveals that Act spent much more per candidate than any other party. Act’s average spend was distorted by it spending nearly $39,000 on leader and Epsom candidate David Seymour’s page, more than twice as much as the next highest-spending candidate, Tim Costley. Most of the ads in question were encouraging viewers to party vote Act rather than to vote for Seymour in Epsom, so much of the spend would be classified as party advertising rather than electorate advertising (electorate ads have a $36,000 limit, while the limit for party ads is just over $1.5 million).
However, other parties had one or two very high-spend candidate pages, with more than $10,000 on digital advertising. National’s Tim Costley, who ran a successful campaign for the Kapiti seat, spent $15,000. Labour’s Mananui Ramsden spent $14,000 – as he was campaigning in the country’s largest electorate, this is perhaps explained by having a big geographical area to cover, and not being able to specifically target ads to people on the Māori electoral roll. Perhaps surprisingly, Shane Jones spent more on his page – $12,547 – than Winston Peters – $7,234. However, Jones has only 50,000 followers to Peters’ 171,000, meaning he has to spend more money to reach people, and he was standing in an electorate (Northland) while Peters wasn't.
In the Google ad transparency tool, it’s possible to see which mediums or platforms get the most spending. In the 2026 election, the vast majority of money was spent on YouTube advertising. YouTube audiences are younger than Facebook users or TV watchers – because Labour spent more money advertising here, it may be that the party wanted to advertise more to younger people.
The Meta data also shows roughly how much money was spent in different parts of the country. This data is grouped by region, rather than by electorate, but it's still telling that more money was spent in Auckland than anywhere else in the country, even when averaged by population. Some of the Facebook candidate pages with the highest ad spends were also in Auckland, including Seymour in Epsom, Dan Bidois in Northcote, Mahesh Muralidhar and Max Harris in Tāmaki and Helen White in Mount Albert.
One narrative that emerged from the 2023 election was how Labour had lost support in Auckland, and National had gained. The amount of money spent on Auckland audiences in the 2026 election shows that all major parties wanted votes from the nation’s biggest city.
Finally, there’s the role of third-party advertisers, whose advertising is also recorded in the Meta data. Some of the third parties are relatively neutral, such as the Electoral Commission or “Every Kiwi Vote Counts”, which encourage enrolment, rather than advocating for any particular party.
Other third-party political advertisers are industry specific; there were two campaigns for changing New Zealand’s medicines regulations and funding more drugs. One was funded by the pharmaceutical companies industry body, and another by Blood Cancer NZ. Infrastructure New Zealand also ran Facebook advertising that publicised different parties’ policies on infrastructure. Most high-spend third-party advertising, however, was paid for by organisations associated with the right, such as Family First, Hobson’s Pledge, the Sensible Sentencing Trust, the Taxpayers’ Union and the Free Speech Union.
According to election advertising rules, registered third-party promoters can spend up to $424,000 on election-related advertising, and unregistered promoters can spend up to $17,000.
Centrist NZ, an AI-heavy publication focused on political news, also spent more than $10,000 on Meta advertising during the election period. The publication was founded by Canadian Jim Grenon; despite its name, its articles and advertising tended to promote a right-wing point of view. Centrist is not a registered third-party advertiser. Split Your Vote, Harry Mowbray’s high-profile campaign aimed at engineering an overhang, did not have any spending registered in the Meta data, and Reality Check Radio (RCR), which ran a similar vote-splitting campaign featuring prominent billboards and pamphlets, spent less than $1,000.
The only left-aligned advertiser that spent more than $4,000 was the New Zealand Council of Trade Unions (NZCTU). Third parties file spending returns only if they spend over $100,000, so digital advertising is a useful insight into which groups have money to spend and the agendas they are promoting. In the Google spending information, only two third parties show up: the NZCTU, which spent $23,800, and the Taxpayers' Union, which spent $25,800.
While it’s possible to see some breakdowns of election advertising data, it’s harder to know what actually works. The geographic data provided by Meta and Google isn’t granular enough to tell whether more advertising was delivered to people in closely fought races. Labour certainly spent more money – but how much of that translated into votes? Digital advertising can say a lot, but with the election result so uncertain, its impact is harder to tell. What is obvious, though, is that Meta and Google are several hundreds of thousands of dollars richer.

Shanti Mathias
Shanti is a contributing writer at The Spinoff with a focus on Christchurch and the South Island. Email her at shanti@thespinoff.co.nz


