


The new and spectacular atlas We Are Here is page after page of haunting, hella beautiful visual data, each chapter introduced with an essay. This one, Lost in the Forest, opens the section on people.
At some point in the 1990s, one of the creators of this book tried to impress me by talking about geography. ‘People think it’s just about making maps,’ he said, ‘but really, it’s about space.’ And as he uttered the word ‘space’, he made this magician’s gesture — a starburst of fingers, spreading like wings, then curving into a slow swooping orbit. As if around a crystal ball, or a new sun. Space! Hand-waving, literally. Anyway, 20 years later, he makes maps. Like, really good ones.
He also started a club called The Data Poets Society, which meets in the University of Auckland’s statistics department, but this club does not write poems. They make pictures that are very beautiful, and maybe that is what people think poetry is. Data poetry! Because ‘Data’ on its own is impersonal; ‘Data’ is an android with a stilted accent, struggling towards humanity. ‘Data’ writes in bullet points, on an invoice. Data visualisation, though, writes sonnets, sestinas and tone poems. Is that right? A poetic thing is something beautiful and abstract, captured in a hard-copy first edition, laid on a mid-century coffee table.
Large-scale quantitative datasets and beautiful pictures these days pervade public understandings of our culture, our society and ourselves — indeed, the very idea of selfhood. If data visualisation is the meeting point between the two, this would explain its hype-value. Its visceral appeal among certain audiences seems to be about seeking the texture and the richness of the qualitative within the quantitative, sensing the soul in the machine. Struggling, like Data, towards humanity.

In a beautiful data visualisation about our social world, the missing texture of a deep and nuanced understanding is replaced by a sensory richness. I sometimes think that the emotional and the aesthetic responses provoked by these visually absorbing abstractions simulate the response to a layer of meaning. When we intellectually grasp the basic press-release-level information communicated by a glance at a good graphic, the pleasure of being able to absorb the patterns in this lovely terrain (from above, as godlike beings) makes the knowledge seem more profound because we are under the impression that we can feel the knowledge. Feel it, sure, the way that we feel poetry, if it is that kind of poetry.
Is this a kind of delusion? Does it help people forget that all quantitative data analysis, no matter how ‘big’ — every variable, every map, every pixel or vector — is data reduction? It is always less than we are, not more. As an actual word poet, Karlo Mila, puts it: ‘Let us not follow the numbers / that make us add up to / not enough / . . . we already know our people to be, / always so much more / than the sum of our parts.’¹
Hot pics are not the only trap. Assume the Eye of God, floating above your Creation. Imagine that Empire in your hands now, leafing through it page by luscious page. Folding over a corner (you are God, no one can tell you off for this). What will you do when you’re done with it? As Umberto Eco asked of Jorge Luis Borges: What are the technical challenges involved in producing, folding up and putting away in your glove compartment a Map of the Empire on a scale of 1:1? Eco concludes that such a map can only reproduce the territory unfaithfully, as the moment this ultimate tool of control is realised,’ the Empire becomes unreproducible’. These may seem like obscure semiotic concerns (because they are), but they are also concerns about power and use.
‘Let me be very clear,’ as our leader says, there can be great social worth in communicating data clearly, accessibly and attractively. But let us not confuse the clear communication of data with making power legible. Like all production of knowledge before it, ‘datavis’ has to be critical and emancipatory, or it is building the master’s house. Or sometimes it is both, but it can never be neither.

I dislike the term ‘data science’, just like I disliked the term ‘Xennial’, and other gross neologisms before eventually succumbing to their use, because I am old — an Xennial, in fact. But data science is sometimes talked about now as something separate from all previous sciences, without an agenda, not sullied by academic ancestry, striking out anew, even though quantitative data analysis has been used in the social sciences and STEM for, oh, quite some time. In the corporate world, data scientist is an upgraded term for what market research agencies used to call ‘quants’. Sample usage: ‘Let’s get a quant on it’, like a cross between Psyduck and a measuring cup. ‘Data science’ is not a new form of magic, nor a terra nullius. It is not pure, and nor is its travelling companion, datavis. Neither can be free of ideology, in either their production or their use. One of my datavis friends has described himself as a ‘data plumber’, allying himself to the artisanal trades as poets and storytellers used to. You make stuff that people use. And what do they use it for?
Another datavis friend was sent a fan letter of sorts for his visualisation, created for a popular publication, of rates of violent and property crimes across a city. The reader offered thanks for this map (not contextualised by any sociological or criminological analysis, or any data on, say, white-collar crimes), as it had helped the reader decide where to buy a house.
Maps and data visualisations inscribe and replicate history and power, including segregation and inequalities, just as algorithms and risk-modelling do. They shit what you feed them: racism in, racism out.

This is why maps, like stories, are statecraft, and both have been primary tools of empire, ownership, colonisation and settlement.³ They are methods for reproducing the Empire — its centres and its margins — and will always be imperfect, because they are about us, without us. They purport to tell us where we are, within a colonised space, and under a coloniser’s gaze. It is no wonder, as Linda Tuhiwai Smith famously observed, that ‘research’ is a dirty word to so many indigenous people, one greeted with ‘a smile that is knowing and distrustful’.
For many of us, if we are in a position to approach the map, our view is from the side eye. That is because we’re not the numbers, as the American writer Lindy West puts it, ‘the numbers are us. They don’t dictate what we do, they reflect it’, and even then, imperfectly, and even even then, they reflect what is done to us more than what we do. It is not just making maps. It’s about space, man. Assuming that we are speaking of relational space, and thus power, which manifests through usage.
I don’t care how ugly or boring a map or a visualisation of data is, as long as it is comprehensible and gets used for something that can help us be free of it. Representation is a swamp in which this work is mired, but if you want to move, you will have to do the work. Get your side eye on; put your queer shoulder to the wheel.
That’s from a poem, by the way.
[1] Obviously, some poems tell stories too. New Zealanders like that, because of the lack of ‘stories about ourselves’. But poems don’t have to tell stories — they don’t have to do anything approaching that kind of usefulness. That’s not the necessary and sufficient condition of a poem. They don’t even have to be beautiful per se, just ‘tight enough so everyone will want to go to bed with you’, according to Frank O’Hara at least. ‘There’s nothing metaphysical about it.’ Poems are free of you, and I suppose that’s why you’d want one.
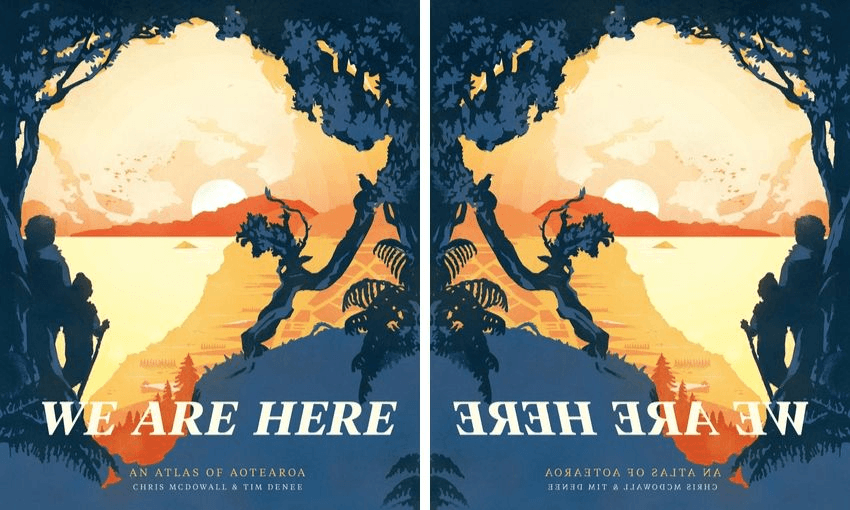
We Are Here: An Atlas of Aotearoa by Chris McDowall & Tim Denee (Massey University Press, $70) is available at Unity Books.