
Did you sense the roads were busier in this Auckland lockdown than previous ones? Google mobility data indicates that you’re right.
More people were going to work, and more heading out shopping, during the current lockdown in Auckland than during the August equivalent, which also took place under alert level three measures.
Mobile phone geolocation data from Google revealed a drop of 47% in workplace visits under the recent measures. Under the same rules in August, the drop was 51%.
People clearly spent more time at home. The data, which measures total number of hours spent at places of residence, found a 23% increase in the last week. In August, the increase was 28%.

“Stay home if you can to avoid any risk of spread,” is the official level three guidance. “You must work from home unless you’re not able to. Children should learn at home if possible.”
Workplaces may operate with measures including physical distancing. Businesses that require close physical contact are not permitted to operate.
Retail and recreation activity fell by almost half in Auckland over the latest level three lockdowns, but the drop was less pronounced than during the August equivalent last year. Under alert level three measures then, activity fell by 57%, compared with 49% this time.
The retail and recreation category measures visits to places such as restaurants, cafés, shopping centres, museums, libraries and cinemas.

Under alert level three, click-and-collect shopping is permitted, and more retailers are equipped to provide those options now than previously. During the level four lockdown, retail and recreation activity across New Zealand fell away almost entirely, with a 90% drop registered.
The activity in the snap lockdown from Valentine’s Day closely matches that from the lockdown that began on Sunday February 28 and concludes on Sunday March 7 at 6am (when Auckland moves to alert level two).
Park usage dropped by only 20%, in marked contrast to the same number in August: 48%. This can be explained, however, by the impact of weather on the baseline measure, which Google calculates as the median value, for the corresponding day of the week, during the five-week period up till February 6 2020.
Supermarket and pharmacy visits were down by 15%, marginally less than the 17% drop of August.
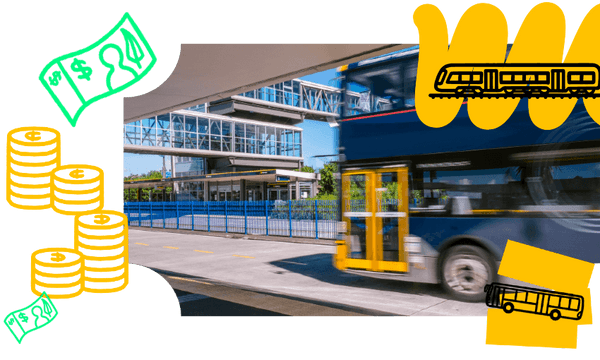
Public transport usage in Auckland was down by 74% from pre-Covid times, but even in alert level one usage is substantially down, by around 40%.
How do the numbers compare with London, which, along with the rest of England, has been formally in lockdown status since the start of January? The change in hours spent at home matches exactly: in Auckland as in Greater London, the increase is 23%.
Workplace visits in London are down 59%, however, compared with a 47% drop in Auckland. Retail and recreation has fallen by 57% in London, with Auckland at 49%.
Auckland’s entry into a form of lockdown for the fourth time prompted warnings of “lockdown fatigue”. The latest lockdown stemmed itself from a breach of the last level three measures, when two people from different households went for a walk together.
On Tuesday, Police said they were “pleased overall with compliance in Auckland under alert level three”.
Google’s mobility reports draw on “aggregated, anonymised” data from users who have opted in to Location History. The reports “aim to provide insights into what has changed in response to policies aimed at combating Covid-19. [They] chart movement trends over time by geography, across different categories of places such as retail and recreation, groceries and pharmacies, parks, transit stations, workplaces, and residential.”