Statistics New Zealand made its quarterly announcement about the consumer price index (CPI) this morning. A percentage number and the word ‘inflation’ always feature in the headlines about these announcements – but what does the CPI actually measure, and why is that about inflation?
What is that percentage?
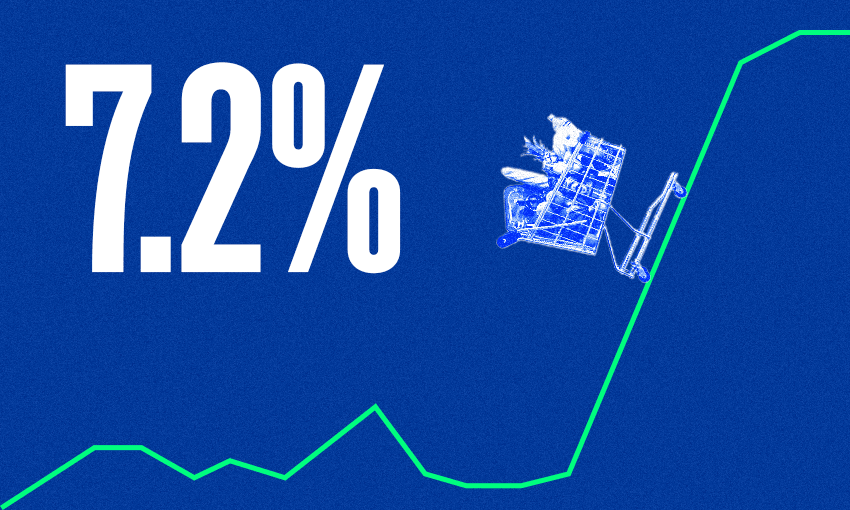
Right now you’ll be seeing the percentage figure of 7.2% everywhere. That is the rate of inflation or inflation figure. That percentage measures the changing price of goods and services bought by households in New Zealand. It’s the change that is used as the primary indicator of inflation. Inflation is the rate of increase in prices over a given period of time. Right now we have high inflation as prices of food, travel and many other things rise at levels not seen since the 1990s. The current rate of inflation is exactly the same as it was for the three months ending September 2022.
So the CPI is the rate of inflation?
The CPI itself is not the inflation figure. The CPI is the index we use to keep track of the changing price of goods and services. It’s a retrospective measure as it looks back on the previous quarter which is simply a division of the year into four three month blocks. Today we got the figure for the months of October, November and December last year.
If it measures one quarter why do people talk about the annual rate of inflation?
Technically there were two percentage rates announced today. One is the quarterly rate of 1.4% which is the change in prices between quarters. The main figure discussed will be the annual rate of inflation of 7.2%. The annual inflation rate is the percentage change in prices paid by consumers between the end of December 2022 and the end of December 2021 for a basket of goods.
Is it a literal basket of goods?
Well technically, there isn’t a giant basket of goods and services sitting at Stats NZ used to measure prices for the CPI but they do visit shops to check prices. The “basket” contains everything from food, alcohol and household utilities like power and internet costs, to transport costs like petrol and catching the bus and health spending like visiting the GP or buying paracetamol. They also send surveys to businesses, collect data on things like the price of streaming services and collate scanning data from supermarkets. Stats NZ collects about 100,000 prices across a range of goods and services.
What’s in this basket?
The “basket” is currently made up of 649 items. The items for the basket are reviewed every three years. This is based on weighting them as items of importance when it comes to household spending. In 2020 vapes were added to the basket as expenditure on them grew. Boys’ sweatshirts and underpants were removed as they were considered an item of low expenditure. Cordless telephones were also removed as people simply don’t buy that many of them anymore.
Why are people talking about tradable and non-tradable inflation?
Tradable inflation covers the rise in prices in goods and services that are imported from overseas or in competition with foreign goods. This figure is currently 8.2%, which is virtually unchanged from last quarter. This percentage tends to be influenced by global events like the war in Ukraine or high oil prices.
Non tradable inflation covers the rise in prices that don’t face competition from overseas, like government charges or what you charged for getting a haircut. It shows how domestic demand and supply conditions are affecting consumer prices. That rate is also largely unchanged from last quarter at 6.6%.


