Chart of the Week: Auckland grows more populous, and older

Auckland, New Zealand – February 28, 2012: People walk across the road in Queen Street Auckland New Zealand.
To launch the new Figure.NZ feature on the Spinoff, here’s how New Zealand’s biggest city has increased in population, and how it is projected to increase further.
To completely disabuse readers of any impression that the Spinoff is Auckland-centric and fixated on the city’s growth, we’ve chosen for the inaugural installment of our new collaboration with the fine people at Figure.NZ a chart that shows the growth of Auckland’s population, historical and projected, and broken down by age.
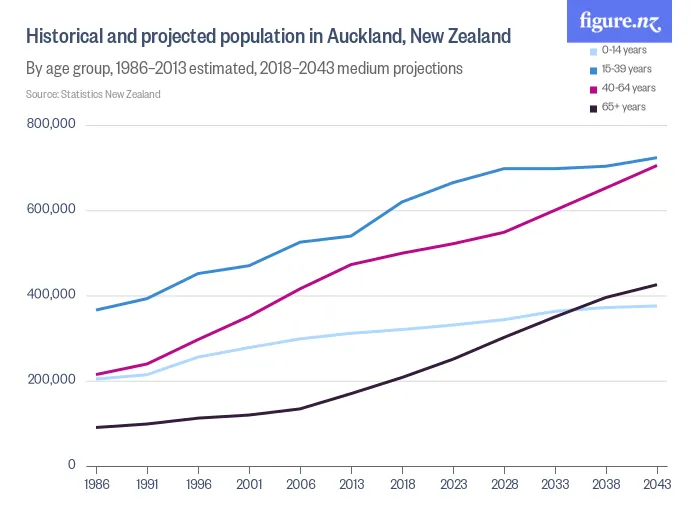
The chart underpins the thinking of the Unitary Plan, and why it simply had to happen.
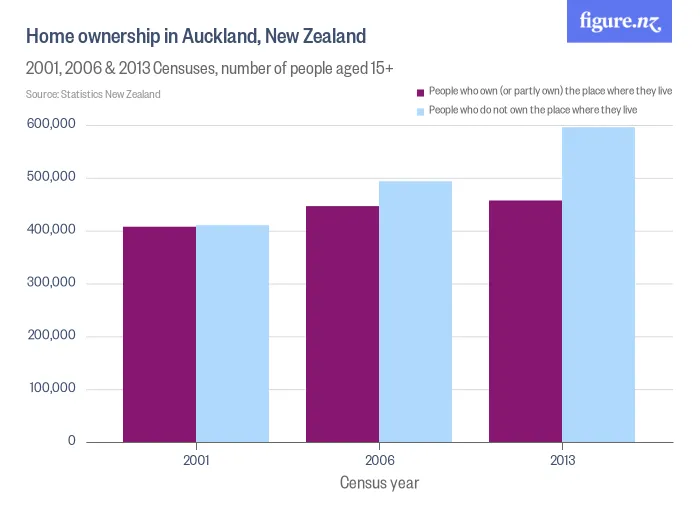
More? Here are some other fascinating charts in a similar vein.
The War for Auckland is a Spinoff pop-up section devoted to the 2016 Unitary Plan and local elections. To support our journalism, click here.


