spinofflive
The speed limit on at least 38 sections of the state highway network are going back up to 100kp/h. (Image: The Spinoff).

OPINIONPoliticsFebruary 10, 2025

A retired anaesthetist on the difference between a crash at 80km/h and 100km/h

The speed limit on at least 38 sections of the state highway network are going back up to 100kp/h. (Image: The Spinoff).

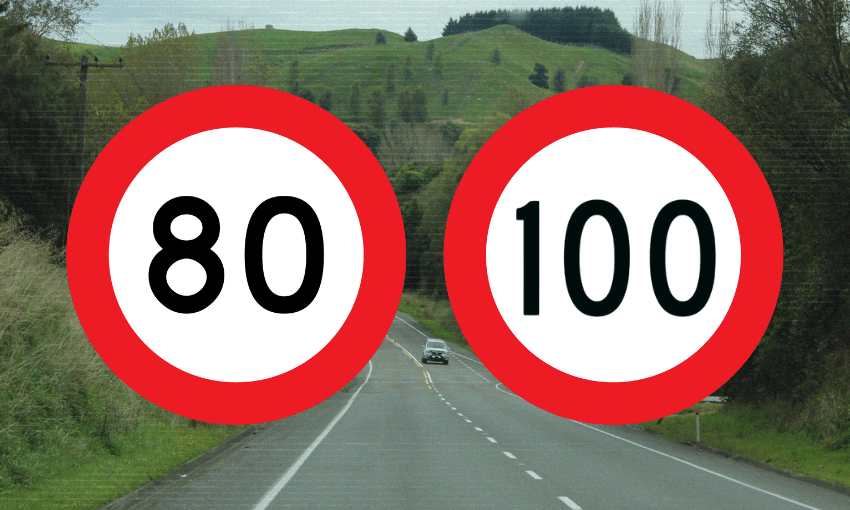
In January, the reversals to speed limit reductions on the state highway network began. Councils have been asked to reverse all reduced speed limits since 2020 by July. A retired rural healthcare worker found something missing from the conversation – a maths equation she learned in high school.

As told to Gabi Lardies

Ask anyone about the effect of a crash when a car is travelling at 100kph as opposed to 80kph, and I bet they would estimate that the former would cause 25% more damage, because 100 is 25% more than 80, right?

Wrong. 

In media reporting, there’s been plenty of discussion that reversing the speed limit reductions will cause more damage, but not exactly how much more. In high school 60 years ago, I learned an equation, the one which calculates the kinetic energy of a moving body. In a car crash it’s the dissipation of this kinetic energy, when the car abruptly stops, that causes damage to the car, the people in the car and whatever the car hits. It is calculated by multiplying half the mass of the moving body by the square of the velocity, like so:

Kinetic energy = mass/2 x velocity²

Or, in a simpler form, KE = m/2 x v²

Now I’m 74 so the faculties are not all that they used to be, but that little superscript ² is the key to understanding the impact of speed on a crash. It’s not linear, like people assume, but exponential. Here’s a simple example. Consider a 100g ball striking, for example, a gentleman’s nether region. At 20kph, the kinetic energy dissipated into his tender parts is 50 x 20 x 20 = 20,000 units of hurt. The same ball travelling at 40kph delivers a kinetic energy of 50 x 40 x 40 = 80,000. If you double the speed, you quadruple the damage. 

So looking at a vehicle, the kinetic energy at 80kph is m/2 x 6,400, whereas at 100kph it is m/2 x 10,000. The increase in kinetic energy for that 20kph increase in speed is just over 56%, not the 25% that people may assume. Then consider that a lot of crashes – particularly on nice, level, straight roads – involve two vehicles, and if they meet head-on, as happens all too often, the velocities are additive. If both vehicles are going at 80kph it will be 160kph. At 100kph it will be 200kph. That could easily be the difference between St Johns putting you on a stretcher or in a body bag.

I worked at rural North Island hospitals for over 30 years. If you’re working in a very small hospital when an accident comes in, it’s very much all hands on deck. You aren’t discriminating between the surgeon and the physician and the anesthetist, everybody does what they are able to do, especially if there is more than one casualty. I’ve seen the fractured skulls, the lacerated livers, the crushed chests, the dead children. There are many times when I remember thinking, “I’m so glad that their relatives will not see them like this”. By the time their family arrives at the hospital, we’ve managed to clean up some of the mess, but there are some messes you cannot clean up. 

You see all sorts of injuries, it depends very much on the impact. Was it a head on collision? Did the car get struck from the side by another vehicle? Were the occupants restrained or unrestrained? You could say there’s almost no injury that you can’t see as a result of a car crash. There’s just so much potential for damage. If you look around the inside of a car – even modern, well-designed cars – there are just so many parts that a human being can strike. People think “I’m driving a nice modern car, it has front and lateral air bags. I have seat belts. I always put my seat belt on”. Those are going to mitigate the damage a bit, they just might make the damage survivable.

(Photo: Johannes Blenke via Unsplash).

The government’s rationale for putting the speed limits back up is to help drive economic growth and improve productivity. It’s been calculated that an average 20-minute urban car trip will be 12-14 seconds faster when the lowered speed limit is removed. When I get overtaken on central North Island roads, I find myself just behind that same car at the next intersection. You’re not gaining that much. If you crash a car at 100kph, the damage will be more than 56% worse than if you crash at 80kph, but you’re not cutting your travelling time down by much at all. The gain in time is very trifling compared to the loss in terms of safety. 

If people crash when driving faster, there will be worse injuries, and there will be deaths, where, at the lower speed, there would have been survivable injuries. There is a lot that we can do for a lot of injuries, but we can’t do anything if you’re already dead by the time they’ve cut you out of the car. It’s as simple and as brutal as that. I know what that 20kph increase means, and it isn’t increased productivity.

A black and white photo of five people sitting at a table. Overlaid are two lines charting unemployment rates: orange from 1987-1993, and red from 2020-2024, with a peak noted at 9.5% and a dip at 4.1%.
Image: Henry Cooke

PoliticsFebruary 10, 2025

Are we back in the early 1990s?

A black and white photo of five people sitting at a table. Overlaid are two lines charting unemployment rates: orange from 1987-1993, and red from 2020-2024, with a peak noted at 9.5% and a dip at 4.1%.
Image: Henry Cooke

The last time New Zealand had this kind of recession we voted in MMP. What might we do this time?

First published in Henry Cooke’s politics newsletter, Museum Street.

New Zealand is not at its best right now.

I write this from afar so I have to rely on brutal headline indicators and the testimony of my friends and family. Unemployment popped up above 5% in the final quarter of last year, with one in 10 Pacifica people out of a job and close to 100,000 young people not in education, training or work. High interest rates and falling house prices have made more secure people feel far poorer. Those able to are leaving the country in record numbers. All this is unsurprising as Aotearoa was in a serious recession last year – the worst six-month decline in GDP since 1991 (if you exclude the pandemic).

Wait a minute. 1991? Stop me if this sounds familiar:

  • A Labour government faces a tough election year (1990) after two terms in office, opting to change its leader at the last minute but not getting anywhere near retaining power. Said leader stays on as few really think the loss is his fault or want the job right away.
  • Interest rates are incredibly high to deal with a very serious inflation spike.
  • Unemployment is high and the economy is going backwards.
  • The incoming National government faces an immediate perceived need to cut government spending as Treasury forecasts widening deficits.

These are the broad outlines of both the 1990 election and the 2023 one, and if you look under the hood the comparisons never really end. “TV3” was in serious financial trouble in 1990, entering receivership at one point. Talk of a referendum on a four-year term was bouncing around. Petrol prices were high as turmoil roiled the Middle East. There was a big debate about cutting government spending on a single ship purchase.

Many familiar faces were there. Winston Peters was causing no end of mischief, consistently critiquing National in his last election fought under that party’s banner. Phil Goff was a leading young minister and key ally of the Labour right, while Helen Clark was threading a very different path towards the centre left. Don Brash was just getting started on his very long term as the governor of the Reserve Bank.

It’s not a perfect match. Things were a lot worse in the early 1990s.

Above is a look at unemployment, using the first quarter of 1987 and 2020 as our basis. As you can see we start at a similar point – but the 1990s recession hurt Kiwi workers a lot more. Interest rates were in the teens, not the single digits. The country’s books were in worse shape in general, giving Ruth Richardson (finance minister in the fourth National government from 1990-1993) far more ammo. Servicing government debt cost a whopping 6.3% of GDP in 1990, compared to 1.7% in 2023.

This led to cuts undertaken by Richardson that were on an entirely different level to those ever contemplated by Nicola Willis. Willis has effectively cut benefit rates in the future by indexing them to price inflation instead of wage inflation; Richardson just straight up slashed them. Willis has changed the parameters for fees-free university; Richardson allowed universities to set whatever fees they liked. Willis is looking to save money in health; Richardson looked to directly introduce a profit motive, with her government at one point suggesting a $50 fee for overnight hospital stays.

Richardson’s many cuts saw government spending shrink from 39.9% of the economy in 1991 to 37.1% in 1993 – which might not sound like a lot, but is quite a bit to manage in two years with spending of this magnitude. Willis is forecast to manage a trim from 33.6% in 2024 to 33.3% in 2026 – a cut of 0.3 percentage points compared to the 2.8 percentage points Richardson achieved. (Looking back at the historic data reveals some very interesting trends in where we spend our government money. In 1991 public health spending sat at 5.2% of GDP, education at 5.8%, and the wider benefits system at 12.8%. In 2024 health had grown to 7.3%, education shrunk to 4.9%, and the benefits system was down to 10.8%.)

And it wasn’t just spending – National also gutted unions with the Employment Contracts Act in the 1990-1993 term, a law change so sweeping that there is still a lively debate in union circles about whether or not they should have undertaken a general strike. Brooke van Velden is doing a lot to give more power to employers right now, but she has a lot less room to move than Richardson and her successor Bill Birch did, as key parts of the the Employment Contracts Act remain in place.

A line graph with two lines, one blue and one red, displaying data from November 1989 to November 1993. The vertical axis represents numerical values ranging from 10 to 70. Both lines fluctuate over the time period.
How National (blue) and Labour (red) were polling between early 1990 and the end of 1993 (Data: The Progress Report)

Richardson earned more of a backlash than Willis and Luxon have ever managed. At this point in the 1990-1993 cycle, Labour was about 10 points clear of National in the polls, as opposed to the single point they appear to be ahead by currently. Richardson required security help from the diplomatic protection squad. And yet National won in 1993.

The 1993 election is one of the most intriguing in modern New Zealand history. National won just 7,100 more votes than Labour, with neither party managing to get much more than a third of the vote, an amazing result in any election, but particularly one under the First Past the Post system that had largely locked out any other party from winning any seats. These two titans of postwar politics, which had both undertaken vigorous reform programmes while many voters looked on aghast, seemed utterly spent forces.

And best of all for voters who hated both of them, they had a way to show it – the MMP referendum held alongside the election. This referendum would create an entirely new world of coalitions and party votes and ways for voters to say not just that they didn’t like the government, but that they didn’t like the government in a specific way. Minor parties were already springing up everywhere, even before the system that would make their continued relevance possible, with Jim Anderton winning almost a fifth of the total vote for his left-wing Alliance and Peters making a strong showing in the first general election outing for NZ First.

As Helen Clark told me for my MMP series on Stuff, they “they wanted to put a ball and chain around politicians’ ankles". We are in very many ways still living in the world that those three years at the start of the 1990s created.

But what does this mean for the next election?

It’s very hard to tell. Under MMP, Labour’s 1993 results would probably have seen them lead the government. But as we have canvassed, there are major differences between our two eras, and it is very unclear if the backlash that National is currently facing will keep growing or peter out as interest rates drop and the economy (one hopes!) picks up. There is, if you are a National Party partisan, plenty of potential upside. National didn’t just scrape a win in 1993 – it actually managed to retain most of its vote in 1996, giving it the chance to lead government for another three years.

Outside of electoral politics, I wonder what might happen if we see discontent build to the level it did in the 1990s without the outlet of the MMP referendum and subsequent humiliation of the political class. A referendum on a four-year term gives one a far weaker avenue of telling the politicians you hate all of them. Where will that energy go instead?

‘Become a member to help us deliver news and features that matter most to Aotearoa.’
Lyric Waiwiri-Smith
— Politics reporter