spinofflive
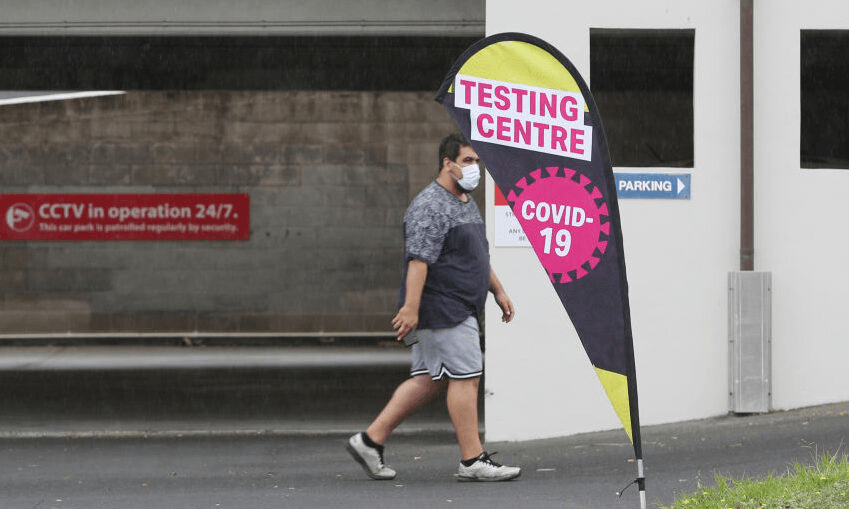
A Covid-19 testing clinic in Auckland (Photo: Greg Bowker/Getty Images)

SocietyApril 19, 2020

A big unknown of Covid-19 in NZ? The number of cases we have not detected

A Covid-19 testing clinic in Auckland (Photo: Greg Bowker/Getty Images)

We can be confident the population prevalence of Covid-19 is less than 1%, but what else can we conclude, asks biostatistics professor Thomas Lumley.

One of the known unknowns about the NZ coronavirus epidemic is the number of cases we have not detected. There will have been a mixture of people who didn’t get any symptoms, people who are going to show symptoms but haven’t yet, people who got moderately sick but didn’t get tested, and people whose deaths were attributed to some pre-existing condition without testing.

In making the decision to loosen restrictions, we care mostly about people who are currently infected, who aren’t (currently) sick enough to get testing, and who aren’t known contacts of previous cases. What can we say about this number — the “community prevalence” of undetected coronavirus infection in New Zealand?

One upper bound is that we’re currently seeing about 1% positive tests in people who either have symptoms or are close contacts of cases. The prevalence in close contacts of cases must be higher than in the general population — this is an infectious disease — so we can be fairly confident the population prevalence is less than 1%.

Are there any other constraints? Well, infection isn’t a static process. If you have coronavirus in 1% of Kiwis, they will pass it on to other people and they themselves will recover. At the moment, under alert level four, the epidemic modellers at Te Pūnaha Matatini are estimating a reproduction number of about 0.5, so 50,000 cases will infect half that many new people. Now, if we’re missing nearly all the cases, the modelling might not be all that accurate, but there would have to be tens of thousands of new infections. And at least a few percent of those new cases will be sick enough to need medical treatment. We would quickly notice that many people showing up to hospitals with (by assumption) no known contacts. It isn’t happening. Personally, I have a hard time believing in a prevalence as high as 0.2%, which would mean 10,000 cases, of which we’re missing over 85%.

The other constraint would come from testing healthy people, which is why the government has started doing that. If you wanted an accurate estimate for the population as a whole, you’d need some sort of random population sample, but in the short term it makes more sense to take a sensibly constructed random sample of supermarkets and then test their customers and employees — if there’s major undetected spread, supermarkets are one of the likely places for it to happen, and they’re also a convenient place to find people who are already leaving home, so you can test them without barging into their bubbles. So, we aren’t getting a true population prevalence estimate, but we are getting an estimate of something a bit like it but probably higher. A good way to structure this kind of sampling would be to pick supermarkets randomly, with probability proportional to the estimated number of customers of the supermarket; you might want to modify that a bit to ensure sampling in some areas for equity and Treaty reasons.

How many do we need to test? It depends on how sure you want to be. If we sample 10,000 people and four are positive, we could estimate prevalence at four out of 10,000, or 0.04%. Actually, given that the test isn’t perfect and misses some cases, we’d estimate about 0.06%. But what if no one is positive? The best estimate clearly isn’t zero.

The question gets more extreme with smaller sample sizes: if we sample 350 people (as was done at the Queenstown Pak’nSave) and find no cases, what can we say about the prevalence? The classical answer, a valuable trick for hallway statistical consulting, is that the chance of seeing no cases in N tests is less than 5% if the true rate is 3/N or higher, So, if we see no cases in 350 people, we can be pretty sure the prevalence was less than 3/350, or about 1%. Since we were already pretty sure the prevalence was way less than 1%, that hasn’t got us much further forward. We’re eventually going to want thousands, or tens of thousands, of tests. The Queenstown testing was only a start.

After that introduction, you’ll understand my reaction when RNZ’s Checkpoint reported there had been a positive test in the Queenstown supermarket, with only two-thirds of the samples run through the lab.

Fortunately, it turns out there had been a misunderstanding and there has not yet been a positive result from this community testing. If the true rate is 0.1% there’s a good chance we’ll see a community-positive test soon; if it’s 0.01%, not for a while. And if we’re really at the level of eliminating community transmission, even longer.

Thomas Lumley is professor of biostatistics at the University of Auckland. An earlier version of this post appeared at StatsChat.
Keep going!
Director of health Ashley Bloomfield, who, on most days, reads the numbers that will define how the rest of this year plays out (Illustration: Simon Chesterman)

SocietyApril 19, 2020

Covid-19: New Zealand cases mapped and charted, April 19

Director of health Ashley Bloomfield, who, on most days, reads the numbers that will define how the rest of this year plays out (Illustration: Simon Chesterman)

The latest in our series of charts, graphics and data visualisations by Chris McDowall. David Garcia helped create today’s charts.

This work is entirely funded by the generosity of The Spinoff Members

These posts collate the most recent statistics and present them as charts and maps. The Ministry of Health typically publishes data updates in the early afternoon, which describe the situation at 9am on the day of release. These data visualisations are interactive – use your mouse or thumb to hover over each graph for more detail.

Note for users of The Spinoff app: if the charts below are not appearing, please update your app to the latest version.

This afternoon’s Ministry of Health figures report that the total number of confirmed and probable Covid-19 cases stands at 1,431 (1,098 confirmed and 333 probable). A total of 912 people have recovered, an increase of 45 since yesterday. There were four new confirmed cases reported in the last 24 hours and five new probable cases. Ashley Bloomfield, the director general of health, announced that the death in Invercargill last Tuesday has now been “confirmed as Covid-19 related”.

The number of significant clusters with 10 or more cases remains at 16. There are 18 people in hospital which is two fewer than yesterday. There are three people in intensive care units, one each in Middlemore, Dunedin and North Shore hospitals. The Dunedin and North Shore patients remain in critical condition.

Yesterday, 4,146 tests were processed. The ministry reported averaging 3,151 Covid-19 lab tests per day during the week ending April 18. A total of 83,224 lab tests have been conducted since January 22. There are 91,059 test supplies in stock — down from 94,820 yesterday.

This chart compares active and recovered cases. Active cases are confirmed or probable cases of Covid-19 where the person has neither recovered nor died. Recovered cases are people who were once an active case, but are at least 10 days since onset and have not exhibited any symptoms for 48 hours.

For the fifth day, Ministry of Health statistics show more recovered than active cases. The number of active cases dropped again, from 544 to 507 this morning. The overall downward trend of active case counts that started around April 8 continues.

I wrote the first of these daily updates nearly three weeks ago, on March 31. I just reviewed the data and noticed that there were 572 active cases on that day. It feels good to write these words from the other side of the curve.

Having said that, please continue to observe alert level four procedures. The numbers are promising, but the risks persist.

The symbol map shows confirmed and probable Covid-19 cases arranged by district health board. In keeping with the relatively small number of new cases, there is minimal change in regional counts. Southern (no change 216), Waitematā (up five to 211), Auckland (no change at 185) and Waikato (up one to 184) remain the four district health boards with the largest number of active cases.

There are 16 significant clusters under investigation by the Ministry of Health, the same as yesterday. Four clusters grew overnight. The Marist College cluster in Auckland grew by one case to 93. The Rosewood aged residential care facility in Christchurch increased by three cases to 43. The World Hereford Conference in Queenstown grew by four cases to 39. Finally, one of the Auckland aged residential care facility clusters increased by three cases to 24.

This chart shows cases by the date they were first entered into EpiSurv, ESR’s public health surveillance system. Note that the number of cases reported on a particular date may not match the number of cases reported in the last 24 hours. This is because the number of confirmed and probable cases reported in the last 24 hours includes cases that were entered on an earlier date as “under investigation” or “suspected” whose status has now been changed to confirmed or probable.

The same broad trend that we see in the other charts is evident here. There is a downward trend in the number of cases. Even with a few potential cases getting upgraded to probable or confirmed in recent days, these numbers look promising.

But wait there's more!