Are we really the fastest repealers in the west? I counted

Image: The Spinoff
John Gregoriadis downloaded the country’s whole body of enacted law and parsed every recorded change. What he found is partly a story about projects begun then scrapped, and partly about the deeper rhythm underneath: a country that keeps unpicking its own work.
Two years ago, Geoffrey Palmer told The Spinoff that New Zealand had gone “from being the fastest lawmakers in the west to the fastest repealers in the west”.
It’s a great line. I wanted to know if it was true. So I downloaded all of it – every act of parliament and every regulation made under one, the country’s whole body of enacted law – and parsed every recorded change. There have been 241,456 of them, the oldest dating to 1872. Then I lined them up against the electoral calendar and zeroed in on the years since 2008.
What the data shows is not a story about one party. It is the opposite. This is partly a story about projects begun then scrapped, and partly about the deeper rhythm underneath them: a country that keeps unpicking its own work. The two are the same problem seen from different angles, and the cancelled projects are where it’s easiest to see.
Zero metres of track
Auckland Light Rail spent $228 million over six years and laid no track at all before it was cancelled in January 2024. At its peak, about $920,000 a week was going to two engineering firms to plan and replan. The cancelled iReX ferry project cost about $671m in all, including $222m just to settle the shipbuilding contract, and produced no ferries; the budget for the replacements now sits on top of that, a projected $1.86 billion. Let’s Get Wellington Moving spent more than $180m before it was disbanded. Three Waters was repealed under urgency. None of these were cheap to start, and none were free to stop.
Add up only the money actually spent – the sunk and cancellation costs, never the speculative “it would have cost billions” projections – and just three of the projects this government cancelled or scrapped account for more than a billion dollars, much of it committed before the 2023 election. That was the discipline the whole way: if I could not point at a dollar that left the building, it did not go in the total.
Year one repeal, year two panic, year three campaign
Palmer’s point was structural, not personal. One house, a slim majority, no written constitution, almost no speed bumps. A government can pass nearly anything in an afternoon and the next one can unpass it just as fast. Put a three-year term on top and you get a familiar rhythm: year one you repeal, year two you panic, year three you campaign. The proposed fix for short-termism, a four-year term, ran out of time in a three-year term and stalled in February.
That is the headline-level story, and other people have told it with other people’s receipts: journalists, Treasury papers, OIA responses. I wanted the primary source. New Zealand publishes all its legislation as open data, free of copyright. Nobody had turned it into a churn metric. So that became the project.
What 241,456 edits say
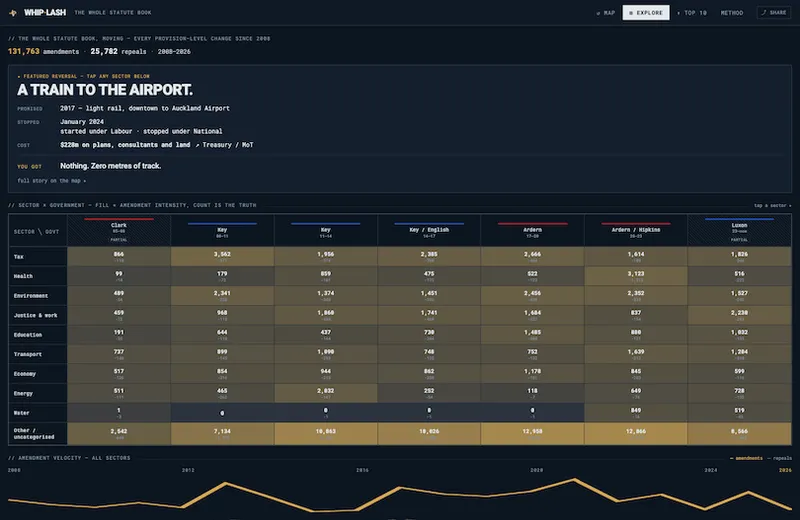
Every government churns at the same rate. Amendment events to acts – not the regulations made under them – per term since 2008 look like this: John Key’s three terms ran 13,426, then 15,144, then 14,584. Jacinda Ardern’s two ran 17,538 and 16,818. The current term is at 12,710 with months still on the clock. Different parties, different decades, different crises, the same band. If you came hoping the data would convict your least favourite party, this is the chart that should change your mind. The churn is not red or blue. It is the machine.
So was Palmer right? I can’t rank us against Britain or Canada from inside our own statute book – that comparison needs their data, not ours. But on the deeper charge, that we’ve become a country that unpicks its own work, the numbers don’t argue. They just don’t pin it on one side.
One honest caveat: this is every amendment, not just reversals. Consequential tidy-ups and routine maintenance are in here too. It shows every government rewrites the statute book at the same rate, which isn’t quite the same as reversing at the same rate. The interactive map (part of the tracker at whiplash.jonno.nz) handles the deliberate U-turns; this is the wider churn behind them.
Keeping that in mind, the most-edited law in the country is the one your livelihood runs on. The Income Tax Act 2007 has 11,577 recorded amendments, roughly three edits every two days for 19 years straight. If a supplier changed your contract three times a week you would sack them. This is the tax code.
The tracker
All of it is live at whiplash.jonno.nz. The map view is those cancelled projects made interactive: 30 reversals and counting, each sized by what it sank, with a timeline you can scrub to replay the last 15 years and watch projects appear and flip. The running total counts only money actually spent. The do-over costs, the replacement ferries, the remerged polytechnics, sit on their own line that is never added to the headline, because the counting rules are the point. Every number links to its source. The churn view is the statute book itself, lane by lane, including the resource-management law whose replacement lasted 122 days.
You can watch a law be born, change and die inside 18 months. The Water Services Entities Act passed in December 2022. The following August its own authors amended it 832 times in a single month. Six months later the next government repealed the whole thing, and sewing the hole shut ran on into 2025, when one tidy-up act made 991 consequential edits across the statute book. The act that repealed the resource-management replacement needed 1,096. Undoing a law turns out to be one of the largest single writing jobs parliament ever does. Reversal is not just policy churn. It is a workload we hand ourselves, twice.
And a law is typically 14 years old when parts of it first get struck out. Hold that against the rest: we make 30-year commitments, govern them on a three-year clock, in laws that begin losing limbs at 14.
Why I did this
I should be straight about where I stand, which is pretty much neutral. No party affiliation, no sign on the fence. I came to this as an engineer who trusts primary sources, and the numbers read the same whichever way you vote.
What they convinced me of is not that one side is reckless. It is that we have quietly accepted a country that cannot hold a plan for longer than one government. The things whose payoff is measured in decades rather than in terms of infrastructure, health, education are the exact things we keep restarting from scratch. Every reversal on that map was a strategy one New Zealand thought through and a later one tore up, and the bill for starting over lands on people too young to have voted for any of it.
That is the part I would put to both sides. Fight about tax and the size of the state and the rest of it; that is the job, and three years is long enough for it. But on the few things meant to outlast a term – the pipes, the wards, the classrooms – build them to survive the handover, so the work becomes cumulative instead of circular. That is worth a cross-party deal for, and not much else is.
Building for the handover: what we need
Measurement, first and cheapest. As of now, New Zealand has a churn metric. That sounds small next to constitutional reform, and it is, but you cannot manage what you do not measure. The UK has published its statute book as open, analysable data for over a decade. We have only just started counting our own reversals, and sunlight is a commitment device too.
Independent institutions with actual teeth. We have already run this experiment and it worked: the Reserve Bank has stayed operationally independent through every government since 1989. Australia’s infrastructure adviser, Infrastructure Australia, has more institutional standing than our newer equivalent, Te Waihanga; both are advisory in the end, but giving Te Waihanga real teeth is boring, proven, and aimed squarely at the billion dollars above.
Cross-party ratification for genuinely long-horizon calls. Hospitals, water, retirement savings, anything whose delivery outlives two parliaments, gets a sign-off both major parties put their name to, so the next team inherits a commitment instead of a target.

The New Zealand Super Fund is the case study in what the absence costs: by the Guardians’ own estimate, the contribution pause that began in 2009 left the fund about $24.5bn smaller by the time payments resumed in December 2017, in missed contributions plus the returns they would have earned. The Zero Carbon Act, passed almost unanimously and then quietly weakened, is the honest caveat. Signatures decay. Which is exactly why the measurement layer matters: decay you can see is decay someone has to answer for.
The election is on November 7. Between now and then, every project on that map and every lane in that statute book belongs to somebody’s record, and the point of the tracker is that “somebody” turns out to be nearly everybody who has held the wheel since 2008.
I didn’t build this to win an argument. I built it because we keep having this one without the numbers in front of us, each side certain the other is the reckless one, nobody counting. So here is the count, in the open, the same for everyone regardless of how they vote. The data is public, the method is on the site, and the whole pipeline is on GitHub. That’s the whole point: not to tell you what to conclude, but to put the thing we’re all arguing about on the table where we can finally see it. Check mine against the source. I’d rather you did and add to the discourse.
John Gregoriadis
John Gregoriadis is a father of two daughters, a senior engineering leader, and a founder in Auckland who still writes the code. He has built and led engineering teams at Xero, Vend, Spotrisk and Prosaic. He builds civic data projects on the side.


