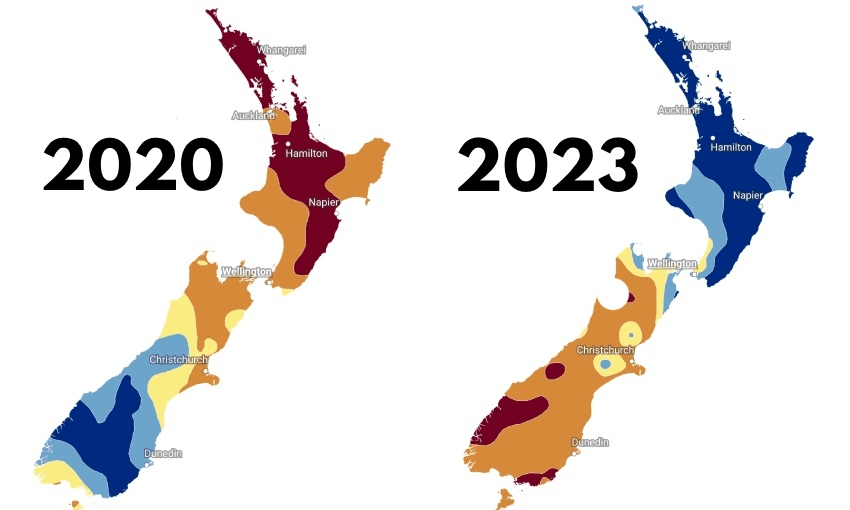
Three years ago, the North Island experienced droughts while the South Island flooded. This year, it’s the opposite.
In January 2023, Auckland experienced its wettest month on record. The heaviest rains occurred on the evening of January 27 when the city received a deluge that overwhelmed stormwater systems and resulted in widespread flash flooding. Over 24 hours, the Albert Park weather station recorded 280 mm — more rain than it typically receives over an entire summer.
Cars floated down suburban streets. Already sodden hills slipped and collapsed into buildings. Homes and businesses filled with water. Rivers changed shape. Four people died. Countless pets and other animals were lost. Emergency responders were superhuman.
Cyclone Gabrielle arrived two weeks later. Once again Northland, Auckland, Coromandel and Bay of Plenty experienced flooding, this time accompanied by gale-force winds. Tairāwhiti and Hawke’s Bay suffered its worst effects and the true extent remains unclear. Half a million people without power. Ten thousand people displaced. The government declared the third national state of emergency in New Zealand’s history. Burst floodbanks, landslides, flooded homes, rooftop evacuations, communication outages and death upon death.
One fucking disaster after another.
Throughout these events my mind keeps returning to a climate change documentary series I worked on with the Spinoff in 2020 called 100 Year Forecast. Specifically, I think about the opening lines of episode two, “Where New Zealand will get wetter and drier”.
“February 4th, 2020. Auckland is in the midst of a big, long dry. No rain has fallen for 21 consecutive days. The very same day in Fiordland so much rain is pouring from the sky a state of emergency is declared. […] One country; two hydrological extremes.”
In February 2020, Aotearoa experienced extreme contrasts between Te Ika-a-Māui North Island and Te Waipounamu South Island. The lower South Island had record-breaking rainfall. This led to a state of emergency declared in Fiordland and Southland, as flooding and landslides forced many to evacuate. This was the largest aerial evacuation in New Zealand’s history, with over 700 people evacuated from the affected areas.
While the south grappled with extreme weather conditions, much of the north faced severe drought. A week after the Fiordland and Southland emergency evacuations, the government declared drought in Northland and parts of Auckland. Months of low rainfall had led to water shortages and crop failure. The situation became so severe that the New Zealand Defence Force was sent to Northland towns to assist in drought relief efforts.
This map shows the north in drought and the south experiencing extremely wet conditions.
Extremely dry weather in the north; deluges and flooding in the south.
Three years on the situation has flipped. As Te Ika-a-Māui endures devastating rainfalls, much of Te Waipounamu has experienced record dry weather. During January 2023, 18 South Island locations observed record or near-record low rainfall totals. Invercargill had its driest January since records began in 1900. Wānaka recorded just 4mm of rain for the whole month.
While climate change cannot be blamed for the existence of Cyclone Gabrielle or a prolonged absence of rain, the scientific consensus is that human warming intensifies these events. We are making everywhere slightly warmer. With every degree of warming, the atmosphere can hold more moisture. A bigger bucket means heavier downpours. But we do not know quite where that water will fall from year to year — just that the future is likely to hold more extreme events as we keep breaking temperature records.
I keep thinking about the contrasting summers of 2020 and 2023. And atmospheric science. And the land. And all those affected. And heartbreaking stories. And the nature of media coverage. And the state of our infrastructure. And the role of policy. And the future of insurance. And action and inaction. And injustice.
Round and round and round.
The complexity makes me realise that I have a cartoon vision of climate change in my head. Dim notions of buckets, greenhouses, thermostats and canaries in coal mines. Metaphors that I mistook for knowledge. They help, but they are not the thing.
Humans have a tendency to avoid uncomfortable truths, whether they’re about the environment, our mortality, or some other difficult aspect of life. The first time I seriously engaged with the prospect of climate change was as a geography undergraduate in the 1990s. Since then I have often worked with environmental scientists and science communicators, getting exposed to the science and implications of climate change.
Despite all those conversations, lectures, graphs and maps, I have not internalised what a changing climate means. I recognise difficult things will come to pass; yet I do not feel the scale and urgency of the issue. Not truly. Not enough.
Staring at maps of February 2020 and January 2023 as gale-force winds bend the oak outside and the radio shares stories of drowning livestock makes the need to reduce carbon emissions feel urgent. But when the sun comes out and the water recedes, urgency risks fading into complacency. It’s a tricky needle to thread. We need to find ways to collectively hold onto our situation's gravity, without becoming overwhelmed and giving up.
Seeking guidance, I turned to the final episode of 100 Year Forecast. In the closing moments, environmentalist and iwi leader Mike Smith (Ngāpuhi, Ngāti Kahu) draws a comparison with the early Covid-19 response.
“Just imagine what would have happened if we had two years lead-in time to prepare for Covid-19 – how different things would have been. With climate change we do have that lead-in time. We do have the opportunity to plan for it. And we do have the opportunity to take action.”
These words give me hope. There will be more devastating environmental events. But there is still time to act and limit their severity. The actions needed are straightforward. Reduce your personal emissions. Reduce consumption and waste. Talk about climate change with the people in your life. Demand action from elected representatives.
There is still time to act. We should act.


