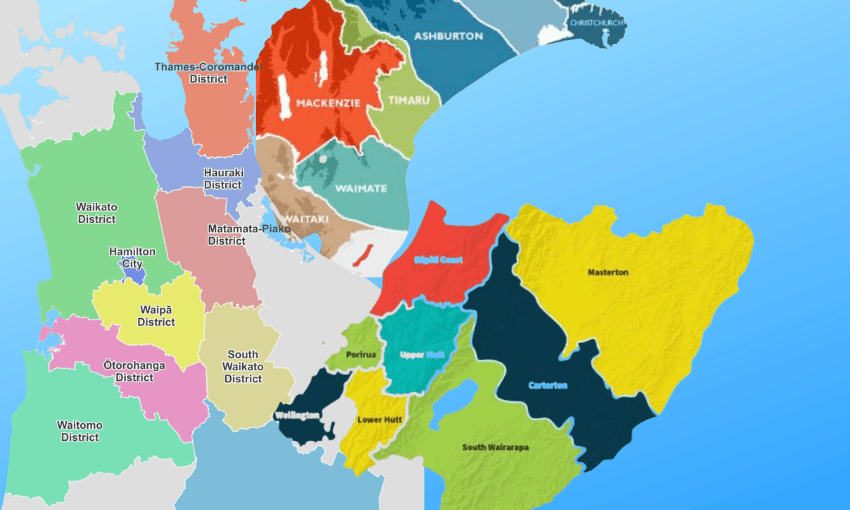
The usual way electoral results maps are presented can be deceiving, over-emphasising large but sparsely populated rural areas and under-emphasising densely populated ones. Here’s another way to make sense of 2023’s election results.
This analysis was updated on 3 November to reflect the final results, following special votes.
The above map gives us a better impression of how New Zealand votes than the traditional geographic map does alone, as we showed last election. It is easier to see how our communities are balanced, and how they compare to the country as a whole.
Before we break down the results, let’s recap how this hexamap adds to our understanding of the political landscape.
The geographic electorate map
We can view the results from election night on the geographic map of New Zealand. This is important for seeing who won which electorates.
However, it can be misleading: the large rural electorates are visually emphasised, and the densely-populated urban areas are obscured, even though they all contain the same amount of people. For example, all 31 Auckland, Wellington, and Christchurch electorates could comfortably fit into Southland or West Coast-Tasman.

The electorate hexamap
Instead, the map below turns each of the 72 electorates into sets of 5 equally-sized hexagons. By presenting the electorates as the same size, we can get a better sense of proportions.
This “hexamap“ reflects the equal power of each electorate, and lets us display the political results more accurately. It retains the general shape of the country, and tries to keep each electorate in a similar position relative to its neighbours.
To help identify the electorates, I’ve labelled the ones with medium-sized cities, and a few of the Auckland electorates. For example, expanding Auckland (due to its large population) pushes Hamilton further south, and Tauranga east; whereas the sprawling West Coast-Tasman shrinks to the corner of the South Island.

Electorate hexamap – candidate vote
First, we can colour the hexamap to show the winners in each electorate. (We’ll look at the party vote further below.)
While the major two parties still won the vast majority of electorates (85% of these seats); this election saw the most electorates won by third parties ever (3 by the Greens, 2 by Act, and 6 by Te Pāti Māori). And it was the first time that any third party won more than a single seat outside the Māori electorates.

While they trailed on election night, Phil Twyford and Rachel Boyack pulled Te Atatū and Nelson back onto Labour’s side by 0.4% and 0.1% (30 votes!), respectively. Helen White also kept Labour’s hold on Mt Albert by 0.1% (20 votes!).
However, special votes also flipped two Labour seats to Te Pāti Māori: Mariameno Kapa-Kingi won Te Tai Tokerau by 1.9%, and Takutai Tarsh Kemp won Tāmaki Makaurau by just 4 votes!
In total, 52% of candidates (37 out of 71*) won with a plurality (<50% of the vote). This includes 13 of the 21 seats flipped by National, and 6 of the 8 seats flipped by the third parties.
*The Port Waikato electorate had no electorate votes counted after a candidate died shortly before the election, which is why that electorate is greyed out.


Electorate hexamap – party vote (total vote)
Second, we can show the combined votes of the left (Labour, Greens, and Te Pāti Māori) versus those on the right (National, Act and NZ First). This analysis excludes the vote share of other third parties outside parliament.
In 2020, 62.3% of the vote was won by parties in government (Labour, Green and NZ First), versus 36.2% to the opposition (National, Act and Te Pāti Māori). This count included the NZ First vote as part of the government due to their 2017 coalition agreement, though they fell below the 5% threshold at the 2020 election.
After the 2023 results were finalised, however, the Left received 44% while the Right got 56%, with NZ First returning to Parliament. This was a significant shift to the Right, with those parties winning more of the collective vote than the Left in 49 out of 72 electorates. 2023 also saw the third highest share of the vote for third parties under MMP (with 35% of voters choosing a party other than National or Labour).
Compared to the initial count, the special votes reduced the Right’s margin by 3%. As a result, National lost 2 seats and Greens picked up a seat, with two overhang seats for Te Pāti Māori (who won 2 electorates seats more than their share of the overall party vote would otherwise entitle them to).

Electorate hexamap – party vote (relative lean)
Finally, we can also use the hexamp to illustrate the political balance of the country. We do this by comparing the combined votes of the left and the right parties to the country as a whole. It’s a similar picture to 2020 (with most changes simply reflecting shifts among the two blocs, such as NZ First’s votes having exited the coalition government with the left parties after 2020).
Whangaparāoa was the most right-leaning electorate (giving 19.4% more of its votes to parties on the Right compared to the country as a whole); while Māngere was the most left-leaning general electorate (voting 30.3% to the Left), and Ikaroa-Rāwhiti the most left-leaning Māori electorate (47.7% to the Left).
Maungakiekie was the electorate that most closely voted like New Zealand as a whole: it gave about the same level of support to left and right parties as the country did overall.