An investigation into the all-important ‘swing voter’ and what they actually believe – with a lot of charts.
This article was first published in Henry Cooke’s politics newsletter, Museum Street.
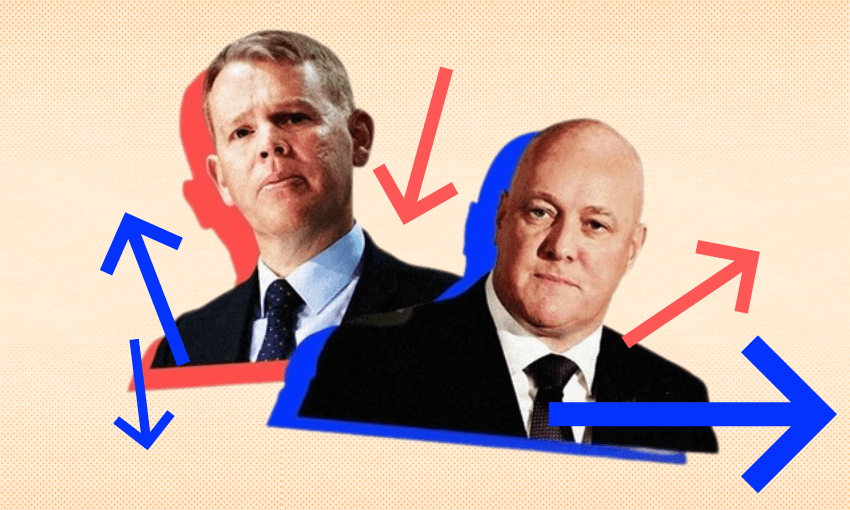
Since its triumphant win in 2020, Labour has lost a lot of supporters.
The exact proportion depends on which poll you trust, but most agree that around a third of the people who party voted Labour are now telling pollsters they will vote for someone else.
Now, it’s easy to overestimate these flows between elections, because the electorate is always changing. New voters are created all the time as people turn 18 or spend enough time in New Zealand, while other voters die or just stop voting. But the shifts here are large enough to be a lot more than that.
The story of this gradual shift away from Labour is the defining narrative of this term, especially if we end up seeing a change in government this year. Labour was never going to keep this much support, but it was not foretold that its support would drop by this much. (Indeed, it is still absolutely possible that it will pick up serious support before the election this year.)
I wanted to get a better idea of who exactly these people are, as they are the ones driving the politics of New Zealand right now. Unfortunately I do not have the thousands of dollars I would need to conduct some good polling on this, but I do have something far richer than a poll: The New Zealand Election Study (NZES) from 2020.
The NZES is an unparalleled resource. For decades a group of political scientists – notably Jack Vowles – have been doing an incredibly in-depth survey of a huge range of voters after every election on a huge range of issues. The latest survey queried well over 3000 voters and non-voters (most polls are of around 1000 people) and asked them hundreds of questions, allowing for fine-grained answers when necessary, such as their exact level of disgust or pride at the notion of Jacinda Ardern having a child in office1.
The huge number of people questioned gives you the ability to narrow things down quite a bit – to look not just at all voters, but a subset of them. That’s what I did in my search to understand Labour’s lost voters.
Finding the swing voters
Now, the NZES was conducted not long after the 2020 election. So using it to work out who is now not voting for Labour requires a bit of informed guesswork and necessary oversimplification.
For the purposes of this post, I have looked at people who party voted Labour in 2020 but National in 2017 – around 15% of the Labour voters questioned2. This is obviously a very imperfect analogue: plenty of 2020 Labour voters who couldn’t even vote in 2017 may have shifted somewhere else. People who voted for Labour in both 2017 and 2020 will have shifted right or left away from the party.
But we do know a sizeable chunk of voters have shifted to National, and given Labour won one out of every two voters in 2020, and is now significantly down, a lot of these new National voters will have come from Labour. And a lot of them will not be “new” National voters – they will be returning ones. After all National won party vote pluralities in the 2008, 2011, 2014, and 2017 elections.
These people are the so-called “swing voters” – the folks who slip around between the main two parties, and I refer to them as such for the rest of the post. You can argue about the exact size of this contingent and whether it really only stays between these two parties (Winston Peters would like a word) – but they are clearly a very major electoral force. So who are they?
They are an upper-income 52-year-old woman who owns their home
Let’s start with the simple demographic stuff, before we dive into what these voters necessarily believe. I think this is quite crucial to understanding that a swing voter is not necessarily an average voter. Indeed the two groups can be quite different.
This group of voters – let’s call them swing voters for now – was on average born in 1971, compared to the wider survey who was on average born in 19753. That means this year they will be 52, while the average voter will be closer to 48.
But averages can miss things a bit – here’s a look at the ages of this voting group in the census bands.
As you can see, while the mean ages might only be four years apart, these are actually fairly different groups, with the general voting population far more likely than one of these swing voters to be younger. (It is worth noting that the sample itself will skew this somewhat – you can’t be a swing voter in 2020 if you couldn’t vote in 2017.)

Like all New Zealanders, they are more likely to be a woman than a man – 58% of our swing voters were women, compared to 51% of the wider sample4.

If we look at income, this group is significantly more likely to come from a household earning more than $102,000 than the wider survey. This doesn’t mean none of them are middle income – but they are generally on the upper end of the income spectrum5.

Higher household income is unsurprisingly associated with a higher rate of of homeownership too – especially mortgage-free ownership. However we should note here that the average voter also owns their own home.

And here is a look at stated ethnicity. As you can see this group is generally more likely to be European than the general survey – and far less likely to be Māori – but not by a giant margin. They are also more likely to say they were born in New Zealand (77% compared to 72%).
There are many areas of demography where these swing voters are pretty close to just representing the average voter.
They are slightly less likely to live in a large town or city (46% to 49%) and slightly less likely to say they “never” go to church (63% to 66%). These differences are close to the margin of error.
On education these swing voters were again very closely matched to the general elector population, with roughly 16% having a bachelor’s degree as their highest qualification, compared to 15% of the general survey, and 17% having no qualification, compared to 17% of the general survey.
The swing voters were a bit more likely to identify as heterosexual – 87.8% compared to 81.4%.
But that’s enough demography. Let’s look at how these voters actually talk about their own political views.
The swing voters’ political views
Parsing someone’s political views can be complicated.
Very few people can confidently explain their exact political ideology, and many will reject the very idea that their views are informed by ideology itself. (They just like “what works”.)6
It is interesting however to see how people place themselves ideologically, and the NZES does ask its respondents to rate themselves on a numerical scale, with “0” being the most left and “10” being the most right. Below is the result.

This shows that this group of swing voters is more likely to rate themselves as just a little bit right-wing than the general public. Of those surveyed, 49% placed themselves on the right (6 or above), compared to 42% of the general response base. The most common answer for the swing voters was “6” – so just a bit to the right of centre – and they were less likely to say they were very right-wing (9 or 10) than the general public.
These eleven-point scales can overstate things – note that the most common answer across the whole survey was “don’t know”7. Luckily, we can ask people a range of questions that are useful to tease out their views, which are often nowhere near as neat and unified as a party platform might suggest.
The economy
Let’s start with economic policy and move onto social issues.

We can start with a big philosophical question: do they think income differences are too large? Here they are somewhat more likely to disagree than the average voter – but not by much. A similar gap exists on another big picture question: Is the government responsible for providing a decent living for the unemployed?

On other fiscal policy, these swing voters often match the rest of the public – they generally like to see more funding going to social services like health and education but not “welfare” benefits – unless you talk about superannuation of course, which is more popular.


These sameiness is also present on questions of debt and taxes. For example, Labour went to the election with a policy of adding a new tax rate on incomes above $180,000, a figure about 1% of the country made at the time.

As you can see a very popular policy (around two thirds support in the general public) that was also fairly popular with this group of voters. And on debt they are with the public on favouring a slower pay down of debt if a faster reduction of debt means a reduction in services.

This is also largely the case for the climate questions I looked at – sorry I don’t have more room to go more deeply into that issue.
Social issues
On social issues things are a bit more complex. These swing voters are a bit more liberal on abortion rights, with 55.6% strongly disagreeing that “abortion is always wrong” – compared to 47.8% of the wider survey.

They are also more liberal when asked if they agree that “women should stay home with children” – 62.1% strongly disagree compared to 54.3% of the wider survey.
This suggests that Labour’s fairly strong move to fully legalise abortion during the 2017-2020 term would have been very well-received by these voters. It’s worth remembering that they are more likely to be women than not. Their views on other hot-button social issues like whether “children need more discipline” largely match the general population.
But if we turn to other non-economic issues like the Treaty of Waitangi things look quite different.

As you can see on this Treaty settlement question, this swing voter is quite to the right of the wider country on the issue of Treaty settlements – and definitely well to the right of the average Labour or Green voter.
So what can we take from all this?
None of this is hugely revelatory: a close look at the attack lines that have worked for the opposition and those that haven’t give you some vague idea of the above data.
The social issues questions certainly suggest that these voters are very susceptible to the attack line both National and Act have been running on for much of the term – that the government is doing too much for Māori on issues like Three Waters. They also explain why Labour was so keen to define Christopher Luxon by his views on abortion.
The data can also show why National generally attacks Labour for the quality of its spending on things like health and education, rather than the quantity. As you can see the wider public and these swing voters too mostly like public spending in these areas and don’t want to cut it just to get debt lower. They also don’t particularly mind the idea of people earning far more than them being taxed – which is why National has dropped its policy to reverse the new tax on those earning over $180,000.

It should also be noted that this survey was taken at a very specific time – before the 2021 lockdowns, before the vaccine rollout, and before widespread inflation. This group of voters were more likely to say they were “proud” of the Covid-19 response than the general public, and less likely to say they were “disgusted”. They also generally had very positive views of Prime Minister Jacinda Ardern herself – a stunning 41% of them gave her a “10” on a likeability scale.

So is this group of voters lost to Labour for good?
With Ardern in charge, probably not. As you can see above they generally really like her – or at least did in 2020. And she is still on top of the preferred prime minister polls.
But it would be a huge hill to climb in some very bad weather. Welcome to election year.
Footnotes
1. Here’s where I will put some of the statistical guff. By my (amateur) calculations the huge sample gives the survey a margin of error of about 2%. The data I have used has been weighted to make it as representative of the general population as possible. A key thing to remember about the survey is that it surveys “electors” – so voters and non-voters. But they do have to be eligible to vote – so no under-18s. I should also say here that NZES 2020 is hosted by the ADA dataverse, I am using this data after requesting access to it, and am wholly responsible for the analysis set fourth here. Any errors are mine alone. I would like to thank some wise advice from Keith Ng and Thomas Lumley however. I have generally rounded to whole numbers within the text but let the decimal places live within graphs.
2. This obviously slims the sample down, so you should take super-exact statistics with a grain of salt.
3. Obviously this doesn’t match the average age of an actual Kiwi (around 37), because the survey only questions people who are 18 or over, and thus eligible to vote.
4. None of the swing voters ticked “gender diverse” although a few didn’t answer.
5. Household income can also be a bit of a weird indicator – when I was flatting with nine other people we technically had a household income that would make us look insanely rich. We were not.
6. As Slavoj Zizek would say: “The minimum necessary structuring ingredient of every ideology is to distance itself from another ideology, to denounce its other as ideology.” I swear I had this ready and didn’t google “Zizek ideology” to remember the exact thing I was after.
7. There is also a very interesting question where respondents are asked to rate how they think political parties sit on this scale. The swing sample and the general sample answered almost exactly the same, FWIW.
This article was first published in Henry Cooke’s politics newsletter, Museum Street.