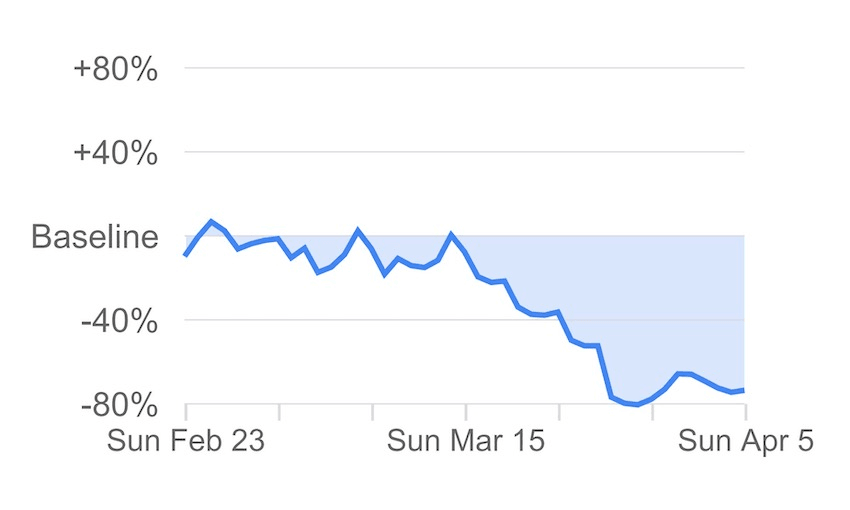
The second week of lockdown mobility data reveals NZ remains compliant with lockdown measures.
Google mobility data covering most of the second week of lockdown shows New Zealand continuing to comply with the rules imposed by the level four lockdown. Compared with week one, the country is near identical in the six categories reported on by Google’s global mobility data, and remains behaviourally far closer to nations like Italy and Spain, which have been hit hardest by Covid-19, than those with more patchwork guidance on the issue, like the US.
The one notable exception to the behavioural consistency is Wellington, which has had a comparative surge in park usage compared to last week. In week one it had shown a lower propensity to stay away from parks, at -63%, versus the national average of -78%. That gap has widened considerably in week two, with the national average moving marginally to -74%, while Wellington’s rose to just -40%. It’s important to note that the data is very blunt and broad, and there are plenty of activities permitted within the level four rules. However, it stands out among New Zealand’s regions as the most notable outlier across the six metrics.
The week concerned covers the day on which the level four restrictions attained a legal basis, Friday April 3 – the same day health minister David Clark admitted to going mountain biking (though before he self-reported driving to a beach for a walk), an incident that served as a powerful demonstrator of the limits on public activity. It also covers the week in which the number of new positive tests began to stabilise and trend downwards.
Below are some of the notable regional variations, with some international comparisons further down. To view the full world collection, head to the mobility home here.
Northland deserves some kind of gold star for restraint, as it led the country in its shunning of parks, at -87%, and was among the most diligent avoiders of retail and recreation, at -93%. With a more rural population than more urbanised regions, some of this is likely to be due to pedestrian accessibility of parks, but it remains a leader in observance of the “stay home, save lives” mantra.
Auckland was largely unchanged from a week before, its park usage essentially flat, -69% versus the previous week’s -70%.
Otago rivals Northland for compliance, with retail and recreation suffering an enormous -95% drop in usage. It outperformed the nation according to every metric, with its residential increase of 39% nation-leading, albeit with not enough data to definitively prove the trend.
Wellington maps with the nation everywhere but park usage, with the upward trend there unchanged even after the guidelines attained a legal basis on Friday April 3. Andrew Geddis has been in touch since this story was published to point out that “all we know is that Wellington is different from other regions. But that tells us nothing useful about “rule following”. Maybe Wellingtonians are exercising in parks at 2m distances, whereas Aucklanders aren’t going to parks and are instead breaching social distancing rules while walking on Tamaki Drive? Maybe Wellingtonians are reading books on the botanic gardens grass while Dunedin students are having beersies across their flats back fences?”
He is entirely correct in this.
Australian mobility data (image: google)Turning to other nations, Australia continues to hail success with its battle against Covid-19, with just 96 new cases announced on Thursday, despite a significantly less-stringent lockdown. Some schools and daycare centres remain open, and its retail and recreation usage has declined by just half that of New Zealand.
Fiji has 15 confirmed cases of Covid-19, and is in full lockdown. This data does not cover this week, when it was hit by Cyclone Harold, a devastating blow on its own, let alone for a nation trying to contain an epidemic.
New York has supplanted Lombardy to become the world’s worst hit sub-region, yet despite its lockdown, mobility data suggests its citizens have modified behaviour less than those in many other regions. New York City is a far more densely populated area than any surveyed above, with most people living in small apartments, which might partly explain the far lower decrease in park usage than in other areas.
The UK’s epidemic continued to spread this week, with PM Boris Johnson spending much of it in intensive care after being hospitalised on Sunday, the last day covered by the data. Retail and grocery traffic is trending lower, but park usage has ticked up, despite frequent exhortations to avoid them. Partial park closures have been actioned in areas of London, and are being considered elsewhere, despite fears such action would disproportionately impact the poor.
Explore the full global mobility data set here
Update: 11.15am – language modified to remove reference to potential “rule-flouting” in Wellington and incorporate comment from the University of Otago’s Andrew Geddis

